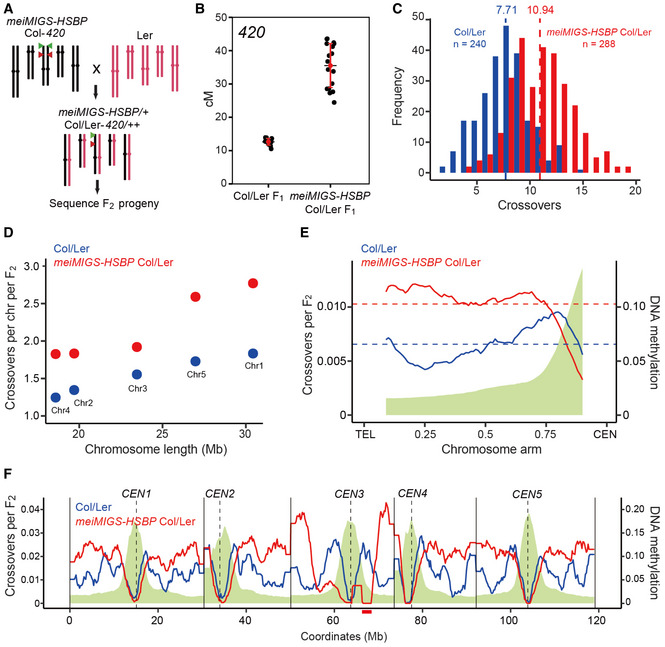
Figure 4. Genome‐wide crossover maps in meiMIGS‐HSBP .

- Schematic diagram of the crossing scheme between meiMIGS‐HSBP Col‐420 (black) and Ler (red) to generate an F2 population for genotyping by sequencing. Green and red triangles indicate the fluorescent reporters in the 420 background on chromosome 3.
- 420 crossover frequencies (in cM) in Col/Ler and meiMIGS‐HSBP Col/Ler F1 hybrids. Red dots and horizontal lines indicate mean ± s.d. of cM values (one‐sided Welch’s t‐test). n ≥ 12 plants of biological replicates.
- Distribution of crossover numbers per F2 individual in Col/Ler (blue) and meiMIGS‐HSBP Col/Ler (red). Vertical dashed lines indicate mean crossover numbers. Significance between genotypes was assessed by one‐sided Welch’s t‐tests.
- Crossover numbers per chromosome in Col/Ler (blue) and meiMIGS‐HSBP Col/Ler (red) F2 populations.
- Normalized crossover frequencies along chromosome arms from the telomere (TEL) to the centromere (CEN) in Col/Ler (blue) and meiMIGS‐HSBP/Ler F2 populations (red). Crossover data for chromosome 3 were excluded due to a possible T‐DNA‐driven chromosome rearrangement. DNA methylation levels are shown in green. Horizontal dashed lines indicate mean values.
- As in (E), without TEL‐CEN scaling. Vertical solid and dashed lines indicate telomeres and centromeres, respectively. The region of T‐DNA‐driven chromosome rearrangement in the pericentromere of chromosome 3 is shown as a solid red underline.
Data information: Significance between genotypes was assessed by one‐sided Wilcoxon tests (D, E).
