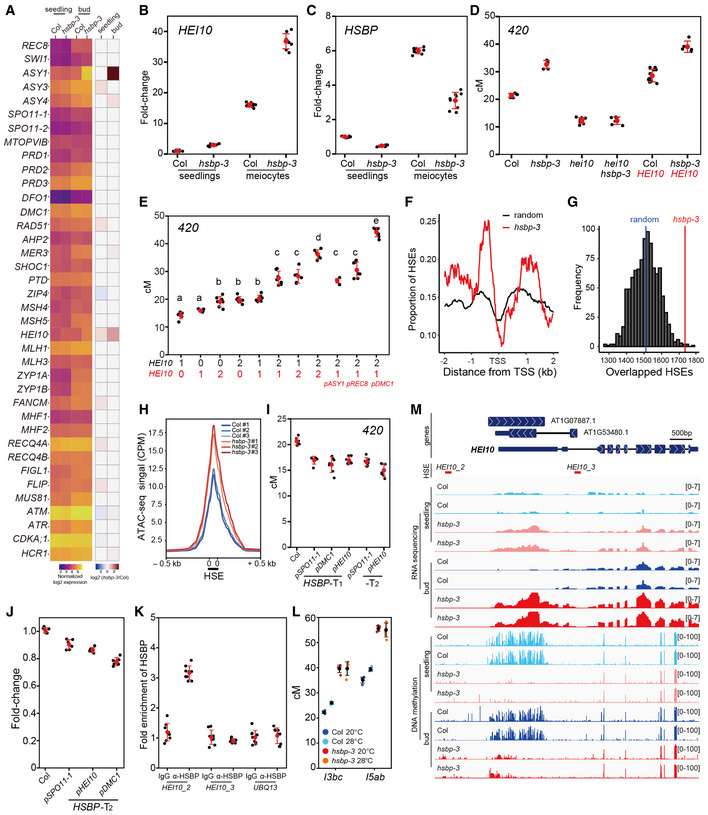
Figure 5. HSBP represses HEI10 transcription via HSF inhibition and DNA methylation.

- Heatmap representation of transcript levels for meiotic recombination genes in Col and hsbp‐3 seedlings and buds from RNA‐seq data.
- HEI10 transcript levels in Col and hsbp‐3 meiocytes, compared with seedlings by RT–qPCR. Experiments were performed at least three times. n ≥ 6 two or three technical duplicates of three biological replicates.
- As in (C), HSBP transcript levels. n ≥ 6 two or three technical duplicates of three biological replicates.
- 420 crossover frequencies in Col, hei10, hsbp‐3, hei10 hsbp‐3, HEI10, and HEI10 hsbp‐3. HEI10 (red), HEI10‐myc transgene. n ≥ 6 plants of biological replicates.
- As in (D), plants with different HEI10 dosage and varying meiotic HEI10 expression from the indicated promoters. Black numbers represent HEI10 and the endogenous HEI10 genotype (0, hei10; 1, hei10/HEI10; 2, HEI10/HEI10). Red numbers represent HEI10 and HEI10‐myc transgene copy number using HEI10 or other meiotic gene promoters. One‐way analysis of variance determined significant differences. n ≥ 6 plants of biological replicates.
- Mean coverage of HSE peaks around the transcription start site (TSS) of upregulated genes (n = 983) in hsbp‐3 (red) and 1,000 sets of 983 randomly selected genes (black).
- As in (F), distribution of simulation frequencies (y‐axis) and HSE numbers (x‐axis) in upregulated genes in hsbp‐3 compared with 1,000 simulations of 983 randomly selected genes. Vertical blue line, mean number of the random HSE sets.
- Mean ATAC‐seq signal around HSEs in Col and hsbp‐3 buds. The y‐axis indicates mean CPM (counts per million mapped reads) of ATAC‐seq.
- As in (D), 420 crossover frequencies in Col and transgenic plants expressing HSBP under the indicated promoters. n ≥ 6 plants of biological replicates.
- As in (B), RT–qPCR analysis of HEI10 in Col and meiotic HSBP transgenic plant (T2) buds. n ≥ 6 two or three technical duplicates of three biological replicates.
- HSBP ChIP–qPCR analysis at the HEI10 promoter in buds. The HEI10 primer positions are shown as red lines in (I). UBQ13, negative control. Experiments were performed three times. Data points (black) indicate three technical duplicates of three biological replicates. Red dots and horizontal lines indicate mean ± s.d. values (one‐sided Welch’s t‐test).
- As in (D), but showing crossover frequency of I3bc and I5ab in Col and hsbp‐3 grown under optimal or high temperatures. Black dots and horizontal lines indicate mean ± s.d. of cM values from individual plants. Colored dots represent cM values of individuals. n ≥ 4 plants of biological replicates.
- Integrative genomic viewer window showing the HEI10 region of RNA‐seq and BS‐seq (DNA methylation) data in Col and hsbp‐3.
Data information: (B, C, J) Data points (black) indicate two or three technical duplicates of three biological replicates. Red dots and horizontal lines indicate mean ± s.d. from duplicates (one‐sided Welch’s t‐test). (D, E, I) Red dots and horizontal lines indicate mean ± s.d. of cM values from individual plants (one‐sided Welch’s t‐test). Black dots represent cM values of individual plants.
