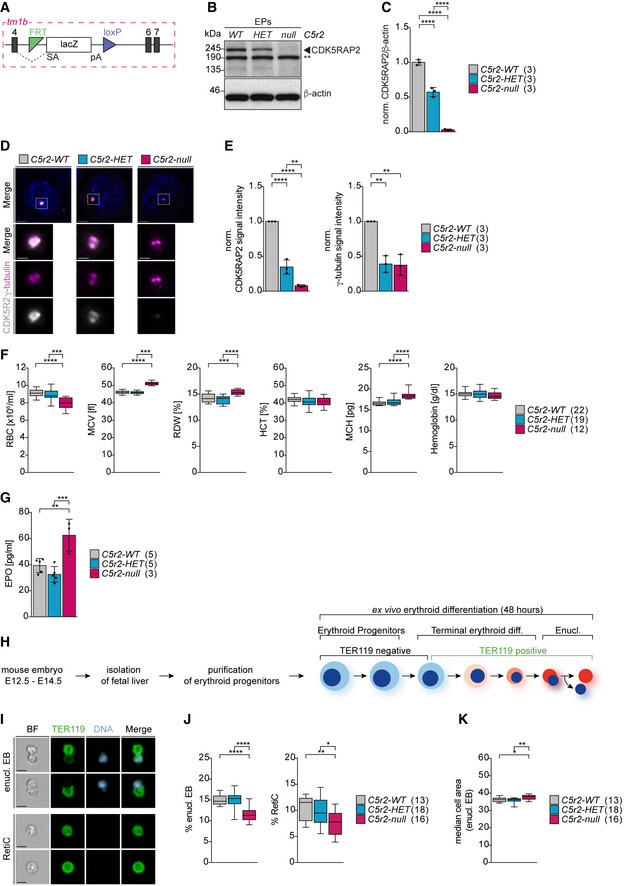
Figure 1. Ex vivo differentiation of Cdk5rap2null erythroblasts recapitulates key features of macrocytic anemia.

- Schematic of Cdk5rap2null (Cdk5rap2tm1b) allele generated from the EUCOMM‐knockout first allele by Cre‐mediated deletion of exon 5.
- Immunoblot showing CDK5RAP2 levels in Cdk5rap2 wild‐type (WT), heterozygous (HET), and null erythroid progenitors (EPs) isolated from fetal livers. Actin was used as loading control. ** indicates non‐specific band.
- Quantification of mean protein levels from (B). Numbers in brackets correspond to number of embryos analyzed.
- Immunofluorescence images of Cdk5rap2 WT, HET, and null erythroid progenitors isolated from fetal livers. Progenitors were stained for CDK5RAP2 (grey), γ‐tubulin (magenta), and DNA (Hoechst, blue). Images are maximum intensity projections of deconvolved z‐stacks. Scale bar, 3 μm. Insets show higher magnification of centrosomes. Scale bar, 1 μm.
- Quantification of mean centrosomal signal intensities of CDK5RAP2 and γ‐tubulin from (D). Numbers in brackets correspond to number of embryos analyzed with a total number of 470 (WT), 406 (HET), and 379 (null) progenitors.
- Complete blood count analysis from adult mice with genotypes as indicated. The number of mice analyzed is shown in brackets. RBC = red blood cell. MCV = mean corpuscular volume. RDW = red blood cell distribution width. HCT = hematocrit. MCH = mean corpuscular hemoglobin.
- Quantification of serum erythropoietin (EPO) levels from adult mice with genotypes as indicated. The number of mice analyzed is shown in brackets.
- Schematic of the ex vivo differentiation culture system.
- ImageStream images of ex vivo cultured enucleating EBs and reticulocytes. Cells were stained for TER119 (erythroid marker, green) and DNA (Hoechst, blue). BF: bright field. Scale bar, 5 μm.
- Quantification of enucleating EBs and reticulocytes after 48 h (T48) in ex vivo culture. Genotypes are as indicated. The numbers in brackets correspond to the number of embryos analyzed.
- Quantification of enucleating EB size from (I). The numbers in brackets refer to the number of embryos analyzed.
Data information: Box plots show 5th and 95th (whiskers) and 25th, 50th, and 75th percentiles (boxes). Bar graphs display mean ± s.d. Statistical analysis was based on the number of embryos (C, E, I, and J) or number of mice (F and G). Statistical significances were determined by one‐way ANOVA test with Tukey’s (C, E, F, G, J) or Kruskal–Wallis test with Dunn's (K) multiple comparisons. *P ≤ 0.05, **P ≤ 0.01, ***P ≤ 0.001, ****P ≤ 0.0001.
