
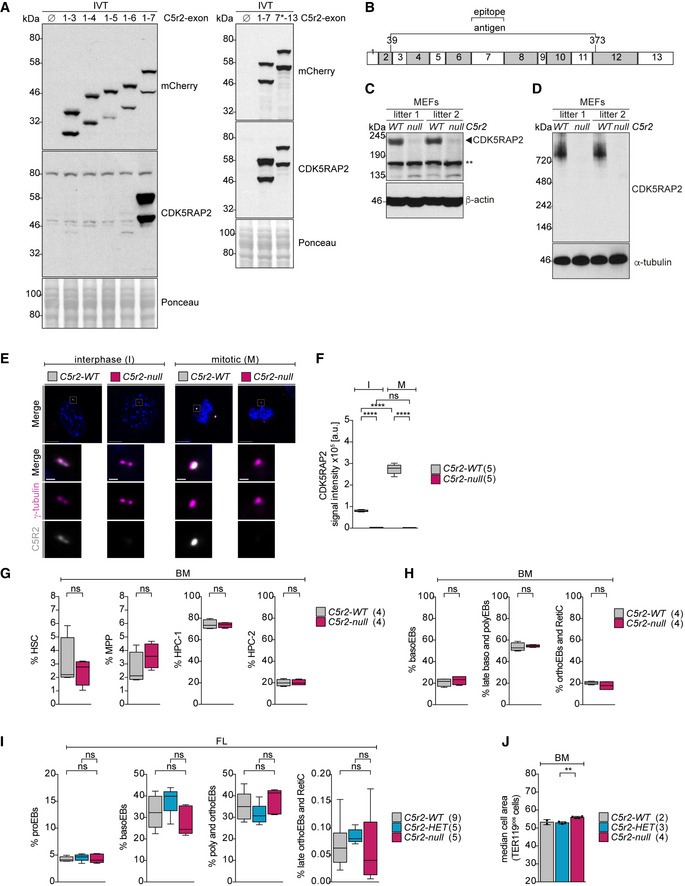
Figure EV1. Hematopoietic progenitor pools are largely normal in Cdk5rap2null mice.
-
AImmunoblot showing the detection of mCherry‐tagged IVT. Ponceau‐S staining was used to compare equal loading. 7* marks the alternative start site in exon 7.
-
BSchematic representation showing the antigen and the epitope of CDK5RAP2 N‐terminal antibody as suggested from IVT experiments in (A).
-
CImmunoblot showing CDK5RAP2 levels in Cdk5rap2 wild‐type (WT) and null mouse embryonic fibroblasts (MEFs). Actin was used as loading control. ** indicates unspecific band.
-
DImmunoblot of native gel showing CDK5RAP2 levels in Cdk5rap2 wild‐type (WT) and null mouse embryonic fibroblasts (MEFs). Tubulin was used as loading control.
-
EImmunofluorescence images of interphase (I) or mitotic (M) Cdk5rap2 WT and null mouse embryonic fibroblasts (MEFs). MEFs were stained for CDK5RAP2 (grey), γ‐tubulin (magenta), and DNA (Hoechst, blue). Images are maximum‐intensity projections of deconvolved z‐stacks. Scale bar, 4 μm. Insets show higher magnification of centrosomes. Scale bar, 500 nm.
-
FQuantification of mean centrosomal signal intensities of CDK5RAP2 from (E). Numbers in brackets correspond to number of MEF lines analyzed with 168 (WT) and 154 (null) interphase cells and 59 (WT) and 56 (null) mitotic cells.
-
G, HQuantification of hematopoietic stem and progenitor cells (G) and erythroblast stages (H) in bone marrow (BM) of 10‐ to 13‐week‐old mice. Genotypes are as indicated. The number in brackets refers to the number of mice analyzed. HSC = hematopoietic stem cells. MPP = multipotent hematopoietic progenitors. HPC = hematopoietic progenitor cells.
-
IQuantification of erythroblast stages in E13.5 fetal livers. Genotypes are as indicated. The number in brackets refers to the number of embryos analyzed.
-
JQuantification of cell size of TER119pos cells in bone marrow (BM) of 10‐week‐old mice. Genotypes are as indicated. The number in brackets refers to the number of mice analyzed.
Data information: Box plots show 5th and 95th (whiskers) and 25th, 50th, and 75th percentiles (boxes). Bar graph in J displays mean ± s.d. Statistical analysis was based on the number of MEF lines (F), the number of mice (G, H, and J), or the number of embryos (I). Statistical significance was determined by one‐way ANOVA with Tukey’s multiple comparisons test (F and I), Mann–Whitney test (G and H), or two‐tailed unpaired Student's t‐test (J). **P ≤ 0.01.