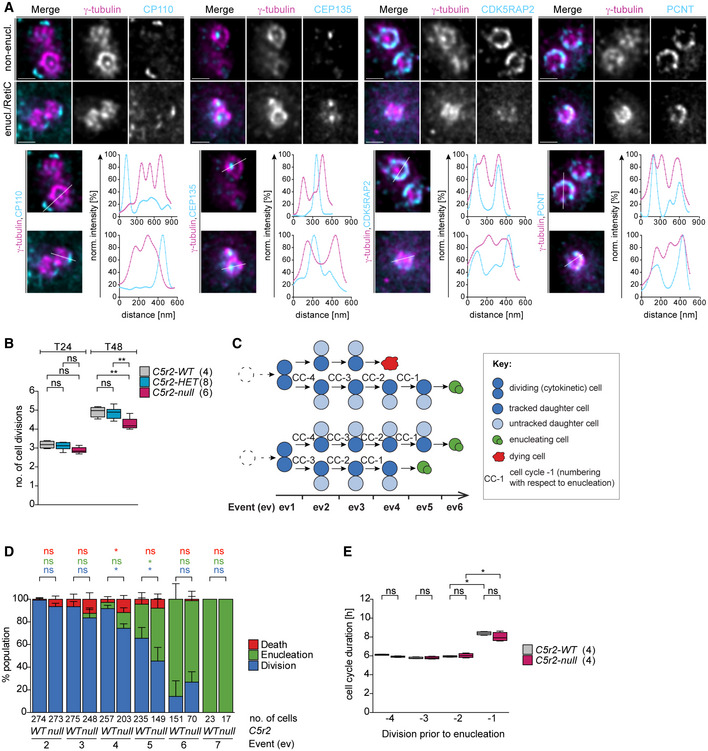
Figure 2. Cdk5rap2null erythroblasts undergo fewer divisions and enucleate prematurely.

- Deconvolved STED images of centrosomes in ex vivo cultured wild‐type non‐enucleating EBs (non‐enucl.) or enucleating EBs/reticulocytes (enucl./RetiC). Cells were stained for γ‐tubulin (magenta) and centriolar (CP110, CEP135) or PCM (CDK5RAP2, PCNT) proteins (cyan). Scale bar, 400 nm.
- Quantification of number of cell divisions after 24 (T24) and 48 (T48) hours. Ex vivo cultured erythroid progenitors with indicated genotypes were labeled with PKH26 to measure cell divisions. The numbers in brackets refer to the number of embryos analyzed.
- Schematic showing how ex vivo cultured erythroid progenitors were tracked in bright‐field time‐lapse microscopy experiments. Briefly, the two daughter cells produced by the first cytokinesis and their progeny were followed through terminal erythroid differentiation. Whenever a cell performed cytokinesis, enucleation, or death, this was recorded as an event (ev). Examples depict paths taken by four daughter cells.
- Quantification of the frequency of cytokinesis, enucleation, and death at each event (ev) in Cdk5rap2 wild‐type or null erythroid progenitors as shown in (C). Four embryos for each genotype were analyzed.
- Quantification of cell cycle duration of Cdk5rap2 wild‐type or null erythroid progenitors. The enucleation event was used as reference point to align previous divisions (see schematic in C). The number in brackets refers to the number of embryos analyzed.
Data information: Box plots show 5th and 95th (whiskers) and 25th, 50th, and 75th percentiles (boxes). Bar graphs display mean ± s.d. All statistical analysis was based on the number of embryos. Statistical significance was determined by one‐way ANOVA with Tukey’s multiple comparisons test (B) or Mann–Whitney U‐test (D and E). *P ≤ 0.05, **P ≤ 0.01.
