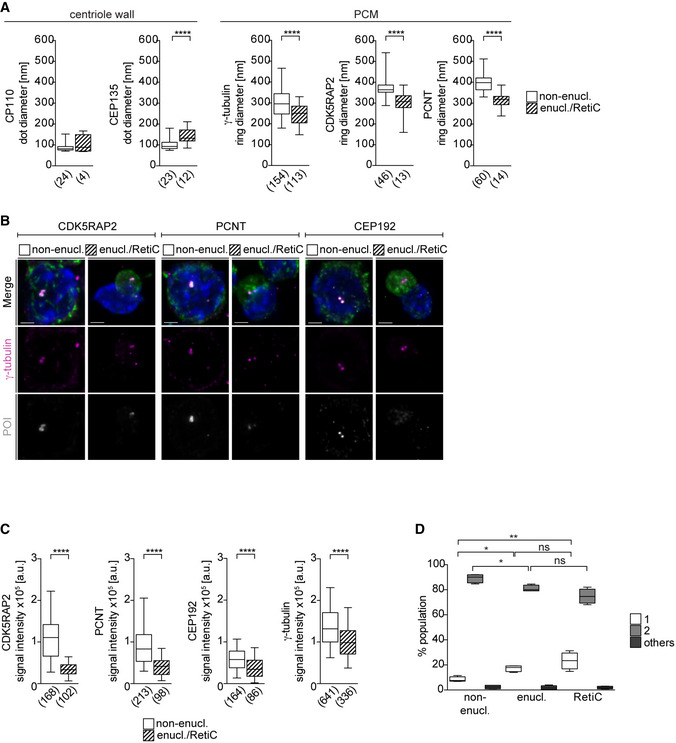
Figure EV2. Intact centrosomes are present in enucleating erythroblasts but their PCM is reduced in size.

- Quantification of signal diameters for centriolar (dot) and PCM proteins (ring) from Fig 2A. The numbers in brackets correspond to the number of centrosomes analyzed in one experiment.
- Immunofluorescence images of ex vivo cultured wild‐type non‐enucleating EBs (non‐enucl.) or enucleating EBs/reticulocytes (enucl./RetiC). Cells were stained for γ‐tubulin (magenta), protein of interest (POI, CDK5RAP2, PCNT, or CEP192 in grey), TER119 (erythroid marker, green), and DNA (Hoechst, blue). Scale bar, 2 μm.
- Quantification of mean centrosomal signal intensities of PCM proteins from (B). The numbers in brackets refer to the number of cells analyzed in one experiment.
- Quantification of centrosome number in ex vivo cultured non‐enucleating and enucleating erythroblasts as well as reticulocytes. Four litters with a total number of 2,618 (non‐enucl.), 715 (enucl.), and 877 (RetiC) cells were analyzed.
Data information: Box plots show 5th and 95th (whiskers) and 25th, 50th, and 75th percentiles (boxes). Statistical analysis was based on the number of centrosomes (A), the number of cells (C), or the number of litters (D). Statistical significances were determined by Mann–Whitney test (A and C) or One‐way ANOVA with Tukey's multiple comparisons test (D). *P ≤ 0.05, **P ≤ 0.01, ****P ≤ 0.0001.
