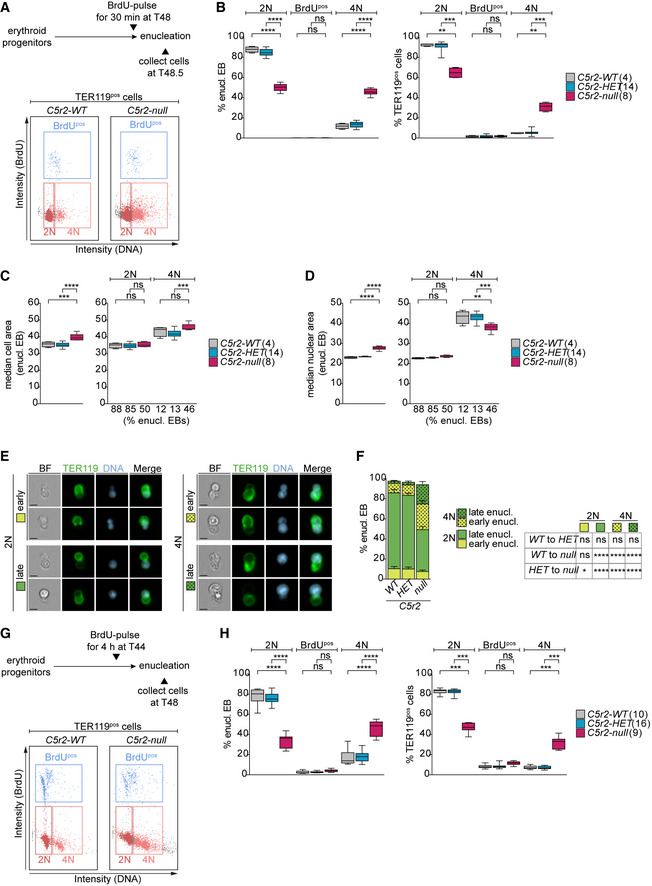
Figure 3. Cdk5rap2null erythroblasts enucleate with 4N DNA content.

-
ASchematic showing the experimental design for BrdU labeling of erythroid progenitors. Exemplary gating profiles of TER119pos cells are shown. The same gating strategy was applied to all samples.
-
BQuantification of cell cycle profiles of enucleating EBs and TER119pos cells from (A). Number of embryos analyzed is shown in brackets.
-
C, DQuantification of cell (C) and nuclear (D) size in enucleating EBs according to DNA content. Percentage of enucleating EBs in each category from (B) is shown below the X‐axis. Number of embryos analyzed is shown in brackets.
-
EImageStream images showing EBs enucleating with 2N or 4N DNA content at different stages from (B). EBs were stained for DNA (Hoechst, blue) and TER119 (erythroid marker, green). Scale bar, 5 μm. BF: bright field.
-
FQuantification of enucleation stages according to DNA content from (B). A total of 4 (WT), 14 (HET), and 8 (null) embryos were analyzed.
-
GSchematic showing the experimental design for BrdU labeling of erythroid progenitors. Exemplary gating profiles of TER119pos cells are shown. The same gating strategy was applied to all samples.
-
HQuantification of cell cycle profiles of enucleating EBs and TER119pos cells from (G). Number of embryos analyzed is shown in brackets.
Data information: Box plots show 5th and 95th (whiskers) and 25th, 50th, and 75th percentiles (boxes). Bar graphs display mean ± s.d. All statistical analysis was based on the number of embryos. Statistical significance was determined by multiple comparisons tests: One‐way ANOVA with Tukey's (B and H left, C–D), Kruskal–Wallis with Dunn's (B and H right), and two‐way ANOVA with Tukey’s (F) multiple comparisons. **P ≤ 0.01, ***P ≤ 0.001, ****P ≤ 0.0001.
