
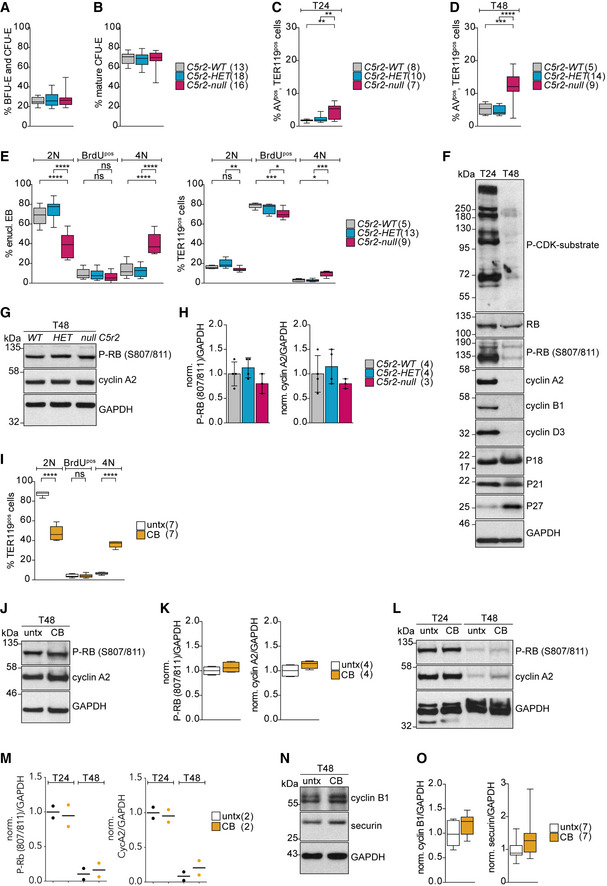
Figure EV3. Cell cycle analysis of Cdk5rap2null erythroid progenitors during ex vivo differentiation.
-
A, BQuantification of ex vivo cultured BFU‐E and CFU‐E (A) as well as mature CFU‐E (B) progenitor populations after 24 h (T24). Genotypes are as indicated. Number of embryos analyzed is shown in brackets.
-
C, DQuantification of apoptotic (AnnexinVpos) TER119pos cells at T24 (C) and T48 (D) of ex vivo culture. Genotypes are as indicated. Number of embryos analyzed is shown in brackets. T24 = 24 h. T48 = 48 h.
-
EQuantification of cell cycle profiles of ex vivo cultured enucleating EBs and TER119pos cells after BrdU pulse for 30 min at 24 h (T24). Genotypes are as indicated. Number of embryos analyzed is shown in brackets.
-
FImmunoblot showing levels of cell cycle markers in wild‐type erythroid progenitors after 24 (T24) and 48 (T48) hours of ex vivo culture.
-
GImmunoblot showing phospho‐RB (S807/811) and cyclin A2 levels in Cdk5rap2 wild‐type (WT), heterozygous (HET), and null erythroid progenitors at 48 h (T48) of ex vivo culture. GAPDH was used as loading control. ** indicates unspecific band.
-
HQuantification of mean protein levels from (G). Number of embryos analyzed is shown in brackets.
-
IQuantification of cell cycle profiles of ex vivo cultured TER119pos cells upon CB treatment from Fig 4E. Number of litters analyzed is shown in brackets.
-
JImmunoblot showing phospho‐RB (S807/811) and cyclin A2 levels in CB‐treated erythroid progenitors at 48 h (T48) of ex vivo culture. GAPDH was used as loading control.
-
KQuantification of mean protein levels from (J). Number of litters analyzed is shown in brackets.
-
LImmunoblot showing phospho‐RB (S807/811) and cyclin A2 levels in CB‐treated erythroid progenitors at 24 (T24) and 48 (T48) hours of ex vivo culture. GAPDH was used as loading control.
-
MQuantification of mean protein levels from (L). Number of litters analyzed is shown in brackets.
-
NImmunoblot sowing cyclin B1 and securin levels in CB‐treated erythroid progenitors at 48 h (T48) of ex vivo culture. GAPDH was used as loading control.
-
OQuantification of mean protein levels from (N). Number of litters analyzed is shown in brackets.
Data information: Box plots show 5th and 95th (whiskers) and 25th, 50th, and 75th percentiles (boxes). Bar graphs display mean ± s.d. Statistical analysis was based on the number of embryos (A‐E) or number of litters (F and L). All statistical significances were determined by one‐way ANOVA with Tukey’s multiple comparisons test. P ≤ 0.05, **P ≤ 0.01, ***P ≤ 0.001, ****P ≤ 0.0001.