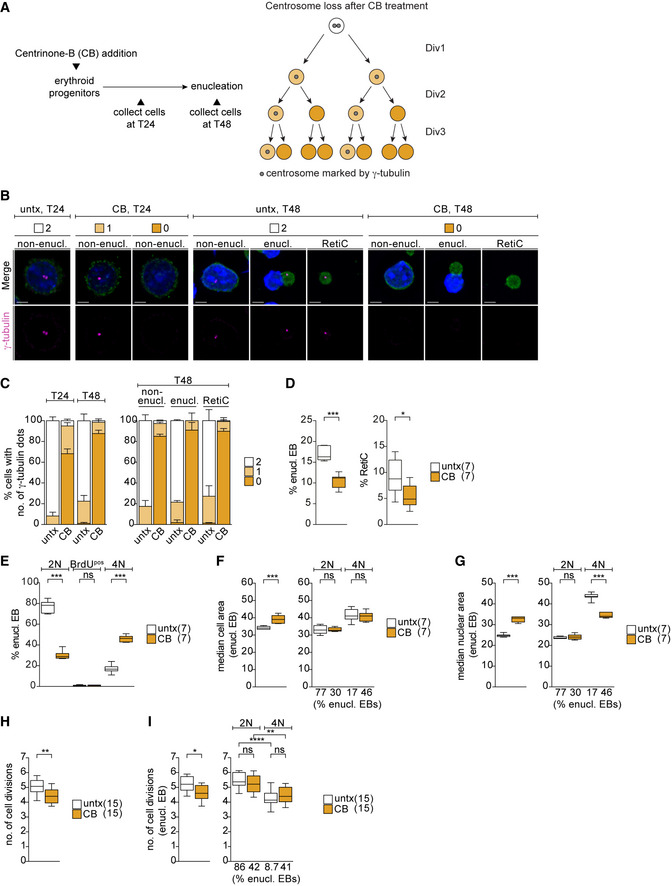
Figure 4. Centrosome depletion closely phenocopies impact of CDK5RAP2 loss on late‐stage erythroblasts.

-
ASchematic shows experimental outline of centrinone‐B (CB) treatment of ex vivo cultured erythroid progenitors. CB treatment results in centrosome loss over multiple divisions as depicted on the right.
-
BImmunofluorescence images of untreated (untx) or CB‐treated erythroid progenitors at stated differentiation stages after 24 (T24) and 48 (T48) hours in ex vivo culture. Cells were stained for γ‐tubulin (magenta), TER119 (erythroid marker, green), and DNA (Hoechst, blue). Scale bar, 3 μm.
-
CQuantification of centrosome numbers (marked by γ‐tubulin) upon CB treatment from (B). For the left panel, in total 632 (untx, T24), 637 (CB, T24), 544 (untx, T48), and 467 (CB, T48) cells from two litters were analyzed. T24 = 24 h. T48 = 48 h. For the right panel, in total 799 (untx, non‐enucl), 142 (untx, enucl), 235 (untx, RetiC), 839 (CB, non‐enucl), 127 (CB, enucl), and 131 (CB, RetiC) cells from two litters were analyzed.
-
DQuantification of enucleating EBs and reticulocytes at T48 of ex vivo culture following CB treatment. Number of litters analyzed is shown in brackets.
- E
-
F, GQuantification of cell (F) and nuclear (G) size at T48 in all enucleating EBs (left panels in F and G) or according to their DNA content (right panels in F and G) following CB treatment of ex vivo culture. Percentage of enucleating EBs in each category from (E) is shown below X‐axis. Number of embryos analyzed is shown in brackets.
-
HQuantification of number of cell divisions at T48 of ex vivo culture following CB treatment. Ex vivo cultured cells were labeled with the membrane dye PKH26 to monitor cell divisions. Number of embryos analyzed is shown in brackets.
-
IQuantification of number of cell divisions at T48 performed as in (H) following CB treatment of ex vivo culture. Left panel shows all enucleating EBs, whereas right panel shows enucleating EBs according to their DNA content. Percentage of enucleating EBs in each category is shown below the X‐axis. Number of embryos analyzed is shown in brackets.
Data information: Box plots show 5th and 95th (whiskers) and 25th, 50th, and 75th percentiles (boxes). Bar graphs display mean ± s.d. Statistical analysis was based on the number of litters (C and D) or number of embryos (E–H). Statistical significance was determined by Mann–Whitney test (D–H and I left) or one‐way ANOVA with Tukey’s multiple comparisons test (I right). *P ≤ 0.05, **P ≤ 0.01, ***P ≤ 0.001, ****P ≤ 0.0001.
