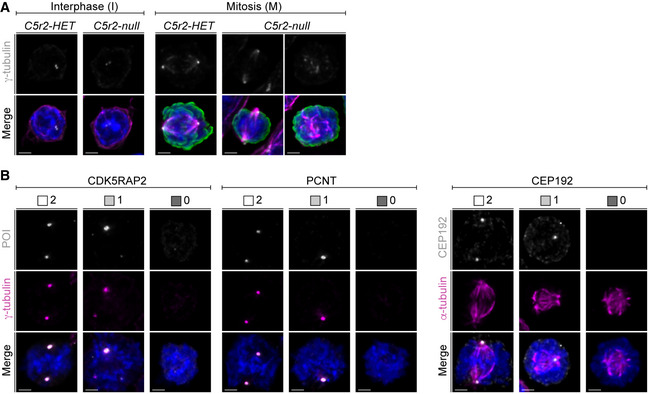
Figure EV5. Effect of centrinone treatment on PCM foci formation in erythroid progenitors during ex vivo differentiation.

- Representative immunofluorescence images of ex vivo cultured Cdk5rap2 HET and null cells in interphase (I) and mitosis (M). Cells were stained for α‐tubulin (magenta), γ‐tubulin (grey), pHH3 (green), and DNA (Hoechst, blue). Images are maximum‐intensity projections of deconvolved z‐stacks. Scale bar, 2 μm. See Fig 6F for quantification of mean centrosomal signal intensities of γ‐tubulin.
- Representative immunofluorescence images of ex vivo cultured mitotic cells (untx and CB) with different PCM foci numbers. Cells were stained for γ‐tubulin or α‐tubulin (magenta), protein of interest (POI, CDK5RAP2, PCNT, or CEP192 in grey), and DNA (Hoechst, blue). Images are maximum‐intensity projections of deconvolved z‐stacks. Scale bar, 2 μm. See Fig 6G for quantification of PCM foci numbers.
