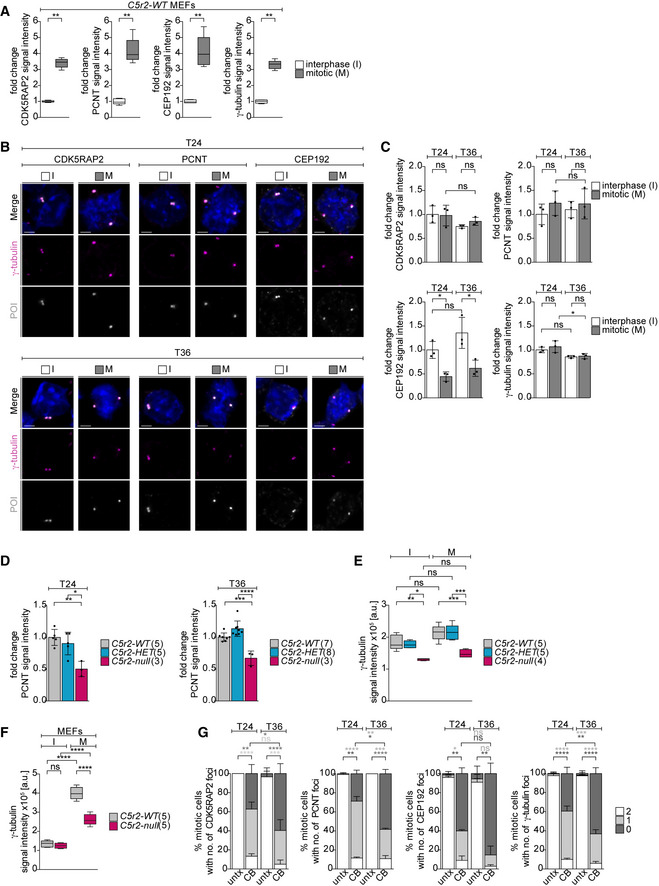
Figure 6. Erythroblasts, unlike MEFs, show no sign of centrosome maturation.

- Quantification of mean centrosomal signal intensities of PCM proteins in wild‐type MEFs. MEF lines (n = 5; independently derived) were analyzed with a total of 168 (CDK5RAP2), 158 (CEP192), 164 (PCNT), and 332 (γ‐tubulin) interphase cells and 59 (CDK5RAP2), 68 (CEP192), 61 (PCNT), and 120 (γ‐tubulin) mitotic cells. Note that the same CDK5RAP2 data also form part of Fig EV1F.
- Immunofluorescence images of cells in interphase (I) and mitosis (M) at 24 (T24) and 36 (T36) hours of ex vivo culture. Cells were stained for γ‐tubulin (magenta), protein of interest (POI, CDK5RAP2, PCNT, or CEP192 in grey), and DNA (Hoechst, blue). Images are maximum‐intensity projections of deconvolved z‐stacks. Scale bar, 2 μm.
- Quantification of mean centrosomal signal intensities of PCM proteins from (B). Three litters were analyzed with the following number of cells for I, T24; M, T24; I, T36; and M, T36: 290, 157, 259, and 174 (CDK5RAP2); 291, 190, 203, and 181 (PCNT); 314, 122, 283, and 152 (CEP192); and 895, 465, 720, and 493 (γ‐tubulin).
- Quantification of mean centrosomal PCNT signal intensities during mitosis at 24 (T24) and 36 (T36) hours of ex vivo culture. Genotypes are as indicated. Number of embryos analyzed is shown in brackets. A total of 227 (WT), 282 (HET), and 158 (null) cells were analyzed for T24 and 370 (WT), 348 (HET), and 196 (null) cells were analyzed for T36.
- Quantification of mean γ‐tubulin signal intensities at interphase or mitotic centrosomes after 36 h (T36) in ex vivo culture. Genotypes are as indicated. Number of embryos analyzed is shown in brackets. A total of 326 (WT), 243 (HET), and 195 (null) interphase cells and 292 (WT), 281 (HET), and 299 (null) mitotic cells were analyzed. See Fig EV6B for representative immunofluorescence images.
- Quantification of mean centrosomal signal intensities of γ‐tubulin from (EV1E). Numbers in brackets correspond to number of MEF lines analyzed with 168 (WT) and 154 (null) interphase cells and 59 (WT) and 56 (null) mitotic cells.
- Quantification of PCM foci numbers in CB‐treated mitotic erythroid progenitors after 24 (T24) and 36 (T36) hours of ex vivo culture. Three litters were analyzed with the following total number of cells for untx, T24; CB, T24; untx, T36; and CB, T36: 141, 221, 174, and 150 (CDK5RAP2); 112, 122, 116, and 85 (PCNT); 165, 183, 145, and 106 (CEP192); and 403, 527, 440, and 411 (γ‐tubulin). See Fig EV5B for representative immunofluorescence images.
Data information: Bar graphs display mean ± s.d. Statistical analysis was based on the number of MEF lines (A and F), number of litters (C and G), or number of embryos (D and E). Statistical significance was determined by Mann–Whitney test (A) or one‐way ANOVA with Tukey’s multiple comparisons test (C–G). *P ≤ 0.05, **P ≤ 0.01, ***P ≤ 0.001, ****P ≤ 0.0001.
