
Figure 7. Elevated TP53 activity resulting from centrosome or CDK5RAP2 loss is not responsible for abnormal erythroblast differentiation.
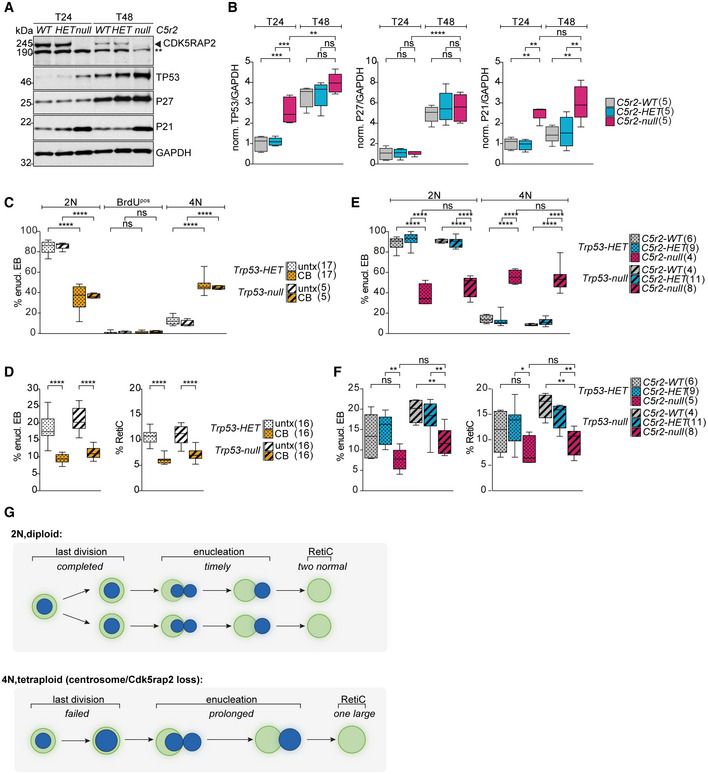
- Immunoblot analysis of TP53, P27, and P21 levels in ex vivo cultured Cdk5rap2 wild‐type (WT), heterozygous (HET), and null EBs after 24 (T24) and 48 (T48) hours. GAPDH was used as loading control. ** Indicates unspecific band.
- Quantification of mean protein levels from (A). Numbers in brackets represent number of embryos analyzed.
- Quantification of ex vivo cultured Trp53HET or Trp53null enucleating EBs and reticulocytes after 48 h (T48) upon CB treatment. Numbers in brackets represent number of embryos analyzed.
- Quantification of cell cycle profiles of ex vivo cultured enucleating EBs with the indicated genotypes after 48 h (T48). Number of embryos analyzed is shown in brackets. See Fig EV6F for cell cycle profiles of TER119pos cells.
- Quantification of ex vivo cultured enucleating EBs and reticulocytes with the indicated genotypes after 48 h (T48). Number of embryos analyzed is shown in brackets.
- Model shows the origin of EBs enucleating with 2N versus 4N DNA content and the consequences on reticulocyte production.
Data information: Box plots show 5th and 95th (whiskers) and 25th, 50th, and 75th percentiles (boxes). All statistical analysis was based on number of embryos. All statistical significances were determined by one‐way ANOVA with Tukey's multiple comparisons test. *P ≤ 0.05, **P ≤ 0.01, ***P ≤ 0.001, ****P ≤ 0.0001.