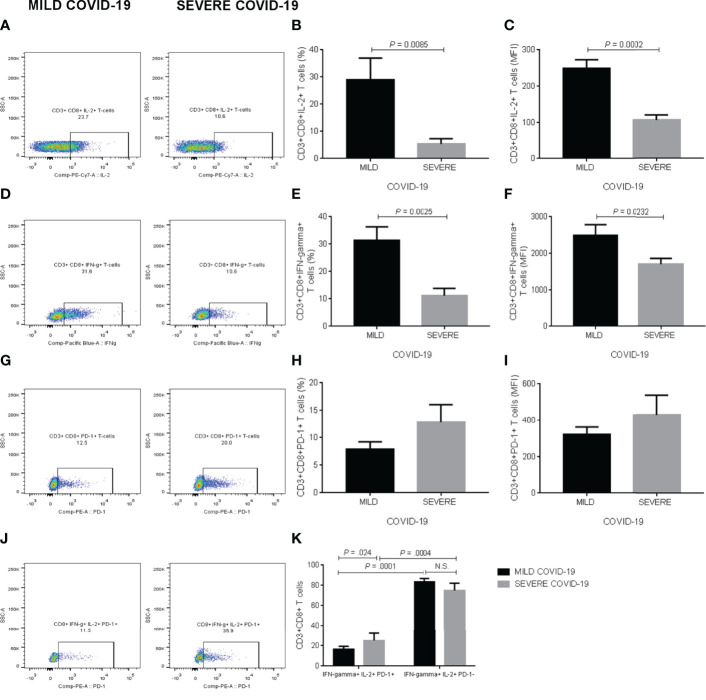
Figure 3.
IL-2, IFN-gamma, and PD-1 expression in CD3+CD8+ T cells in response to polyclonal stimuli in vitro. (A) Representative dot-plots illustrating the comparison of CD3+CD8+ T cells expressing IL-2 in blood samples treated with polyclonal stimuli from participants who developed mild or severe COVID-19 during the follow-up. (B) Percentage of CD3+CD8+ T cells expressing IL-2. (C) Mean fluorescence intensity of IL-2 in CD3+CD8+ T cells. (D) Representative dot-plots exemplifying the contrast of CD3+CD8+ T cells expressing IFN-gamma in whole blood samples exposed to polyclonal molecules from participants who experienced mild or severe COVID-19 throughout the follow-up. (E) Percentage of CD3+CD8+ T cells expressing IFN-gamma. (F) Mean fluorescence intensity of IFN-gamma in CD3+CD8+ T cells. (G) Representative dot-plots illustrating the comparison of CD3+CD8+ T cells expressing PD-1 in blood samples treated with polyclonal stimuli from participants who developed mild or severe COVID-19 during the follow-up. (H) Percentage of CD3+CD8+ T cells expressing PD-1. (I) Mean fluorescence intensity of PD-1 in CD3+CD8+ T cells. (J) Representative dot-plots exemplifying the contrast of CD3+CD8+ T cells simultaneously expressing IL-2, IFN-gamma, and PD-1 in whole blood samples exposed to polyclonal molecules from participants who experienced mild or severe COVID-19 throughout the follow-up. (K) Percentage of CD3+CD8+ T cells producing both IL-2 and IFN-gamma depending on PD-1 expression. Prior to infection, we obtained whole blood samples from all participants enrolled in the study and cultured them with polyclonal stimuli, including anti-CD3, anti-CD28, poly I:C, and SARS-CoV-2 recombinant spike S1 protein for two hours. We then acquired CD3+CD8+ T cells on a BD FACS Canto II Flow Cytometer, acquiring 10,000 events per test in triplicate and storing data until a participant got SARS-CoV-2 infection. Upon infection and depending on the clinical course of the disease, we analyzed flow cytometry data as part of the mild or severe COVID-19 groups. Black bars represent the mild COVID-19 group. Gray bars represent the severe COVID-19 group. We expressed data as mean ± standard deviation. We compared data using the unpaired Student’s T-test or two-way ANOVA and considered differences significant when P < 0.05. IL-2, interleukin-2; IFN-gamma, interferon-gamma; PD-1, programmed cell death protein 1; MFI, mean fluorescence intensity; COVID-19, coronavirus disease 2019; SARS-CoV-2, severe acute respiratory syndrome coronavirus type 2.

