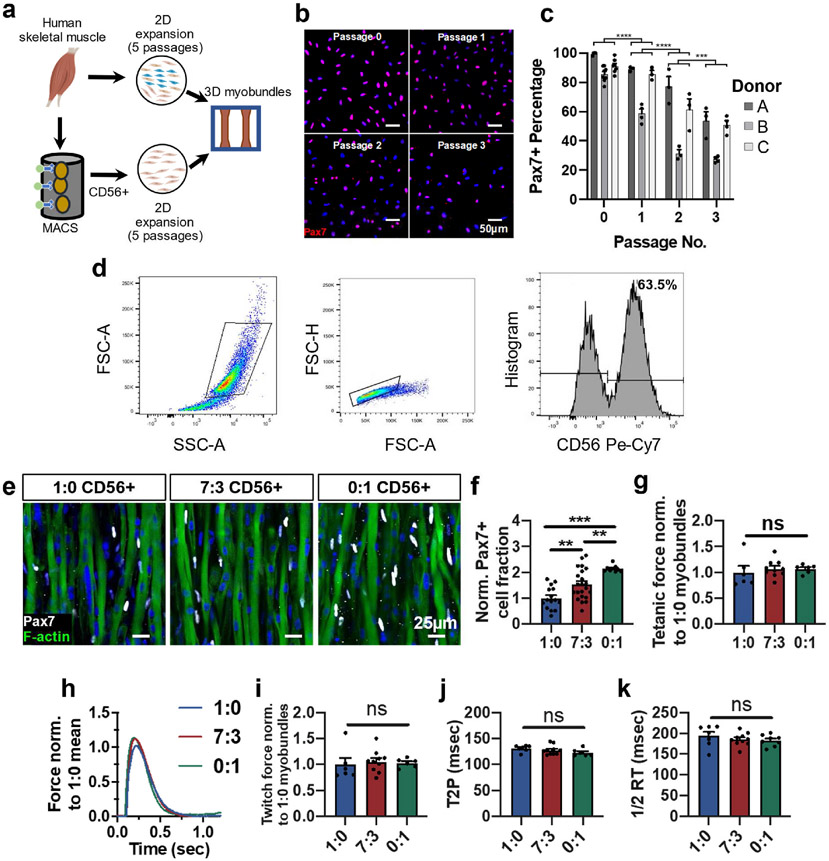
Fig. 1. CD56-based myoblast purification to increase formation of Pax7+ cells in myobundles.
a, Schematic of experimental flow from primary muscle cell isolation to 2D culture (unsorted or CD56+ MACS enrichment) and myobundle construction. b,c, Representative images of Pax7 staining in expanded CD56+ cells (nuclei stained with DAPI) at specified passages (b) and corresponding quantification (c, n = 3–6 coverslips per passage per donor, N = 3 donors). d, Representative flow cytometry analysis of muscle cell population expanded for 5 passages from muscle biopsy, highlighting the CD56+ cell fraction. e,f Representative whole bundle stains of 1-week differentiated myobundles with varying ratios (1:0, 7:3, and 0:1) of initial heterogeneous cells to CD56+ cells stained for Pax7 and F-actin (e) and corresponding quantification of Pax7 cell fraction normalized to 1:0 group (f, N = 1 donor, n = 9–22 myobundles per group). g, Tetanic force of 1-week differentiated myobundles normalized to 1:0 group (N = 1 donor, n = 4–10 myobundles per group). h, Representative twitch force trace from 1-week differentiated myobundles comprised with varying ratios (1:0, 7:3, and 0:1) of initial heterogeneous cells to CD56+ cells normalized to the mean twitch force of 1:0 myobundles and quantified twitch force (i), time to peak tension (T2P, j), and half-relaxation time (1/2 RT, k) (N = 1 donor, n = 6–10 myobundles per group). Data: mean ± SEM. *p < .05, **p < .01, ***p < .001; ns, not significant.

