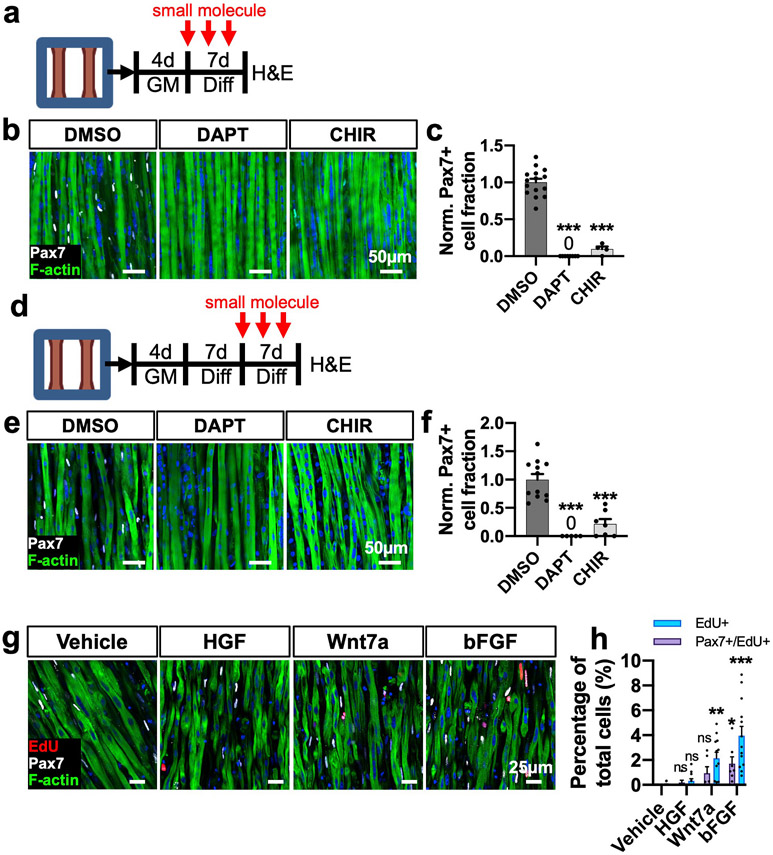
Fig. 3. Notch and Wnt modulation on 3D SC quiescence and maintenance.
a, Schematic diagram of experimental design and treatment timing (GM: 3D growth media, Diff: 3D differentiation media). b, Representative images of whole-mount myobundles treated with DMSO (vehicle control), DAPT (3 μm), or CHIR (3 μm) during the first week of 3D differentiation stained for Pax7 and F-actin. c, Quantification of normalized Pax7+ cell fraction from whole myobundle stains (N = 1 donor, n = 4–15 myobundles per group). d, Schematic diagram of experimental design and treatment timing. e, Representative images of whole-mount myobundles treated with DMSO, CHIR, or DAPT during the second week of 3D differentiation stained for Pax7 and F-actin. f, Quantification of normalized Pax7 cell fraction from whole myobundle stains (N = 1 donors, n = 5–12 myobundles per group). g, Representative longitudinal sections of 14-day myobundles stained for EdU, Pax7, and F-actin after 1 week of treatment with specified growth factors. h, Quantification of EdU + percentage of nuclei (N = 2 donors, n = 6–13 myobundles per group). Data: mean ± SEM. *p < .05; **p < .01; ***p < .001; ns, not significant.

