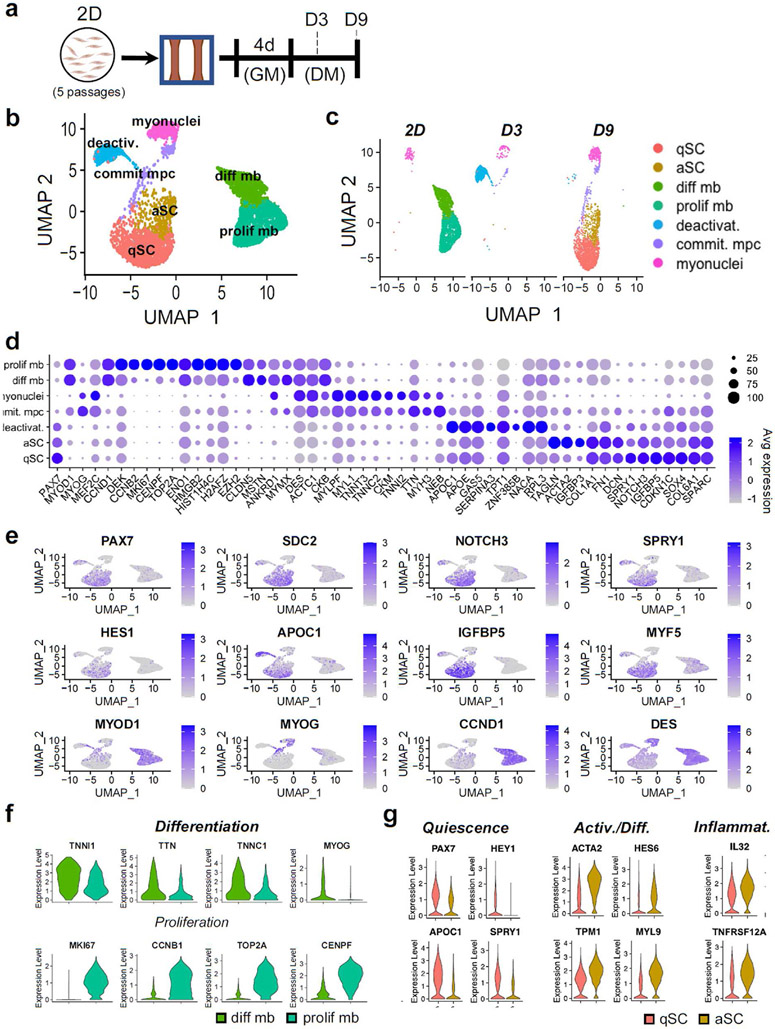
Fig. 4. scRNA-seq clustering and marker analysis.
a, Schematic diagram of experimental layout. b, UMAP plot of cells isolated from all conditions. Each dot represents 1 cell, which is assigned to a distinctly colored cluster as identified by clustering analysis. c, UMAP plot split by each analyzed cell population (at different days of 2D and 3D culture) with cells colored by cluster. d, Dot plots displaying gene expression for each cluster with dot size representing percentage of cells expressing the gene and color representing average level of gene expression. e, UMAP plot with expression of selected genes associated with SC quiescence, activation, and myogenesis. f, Violin plots of the differentiating myoblast and proliferative myoblast clusters for differentiation and proliferation markers (padj < .01). g, Violin plots for the quiescent 3D-SC (qSC) and activated 3D-SC (aSC) cluster from the D9 condition for quiescence, activation, differentiation, and inflammatory markers (padj < .01).

