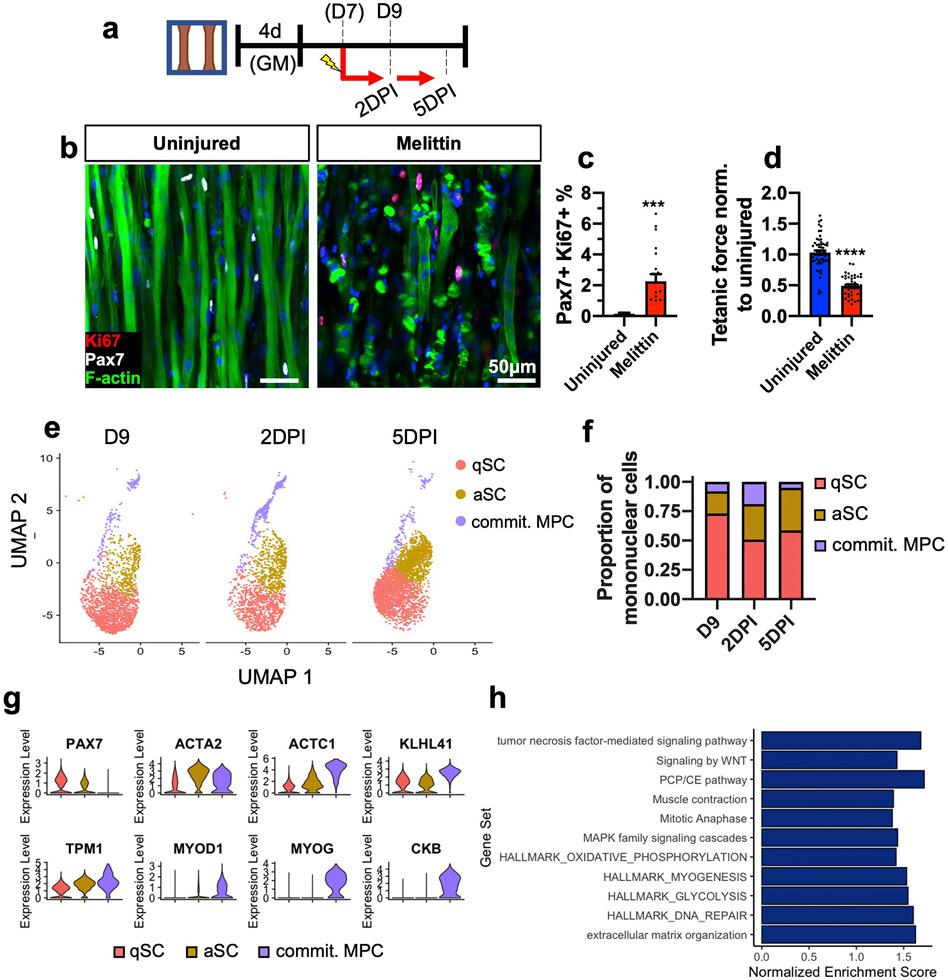
Fig. 6. Response of Myobundles and 3D SCs to injury.
a, Schematic diagram of experimental layout. DPI, days post-injury. b-d) Representative images of 1-week differentiated myobundles uninjured or injured by melittin and stained for Pax7, Ki67, and F-actin 2 days post-injury (b) and corresponding quantifications of percent Pax7+ Ki67+ nuclei (c, N = 2 donors, n = 20 myobundles per group) and tetanic force normalized to uninjured control (d, N = 3 donors, n = 44–60 myobundles per group). e,f UMAP plot of qSCs, aSCs, and committed MPCs at D9, 2DPI, and 5DPI (e) and corresponding proportions of each subpopulation within the total cell number (f). g, Violin plots of selected genes for the qSC and aSC clusters across all timepoints. h, GSEA of the 2DPI and 5DPI versus D9 aSC cluster with selected Gene Ontology and Reactome annotations (q < 0.05). Data: mean ± SEM. *p < .05; **p < .01; ***p < .001.

