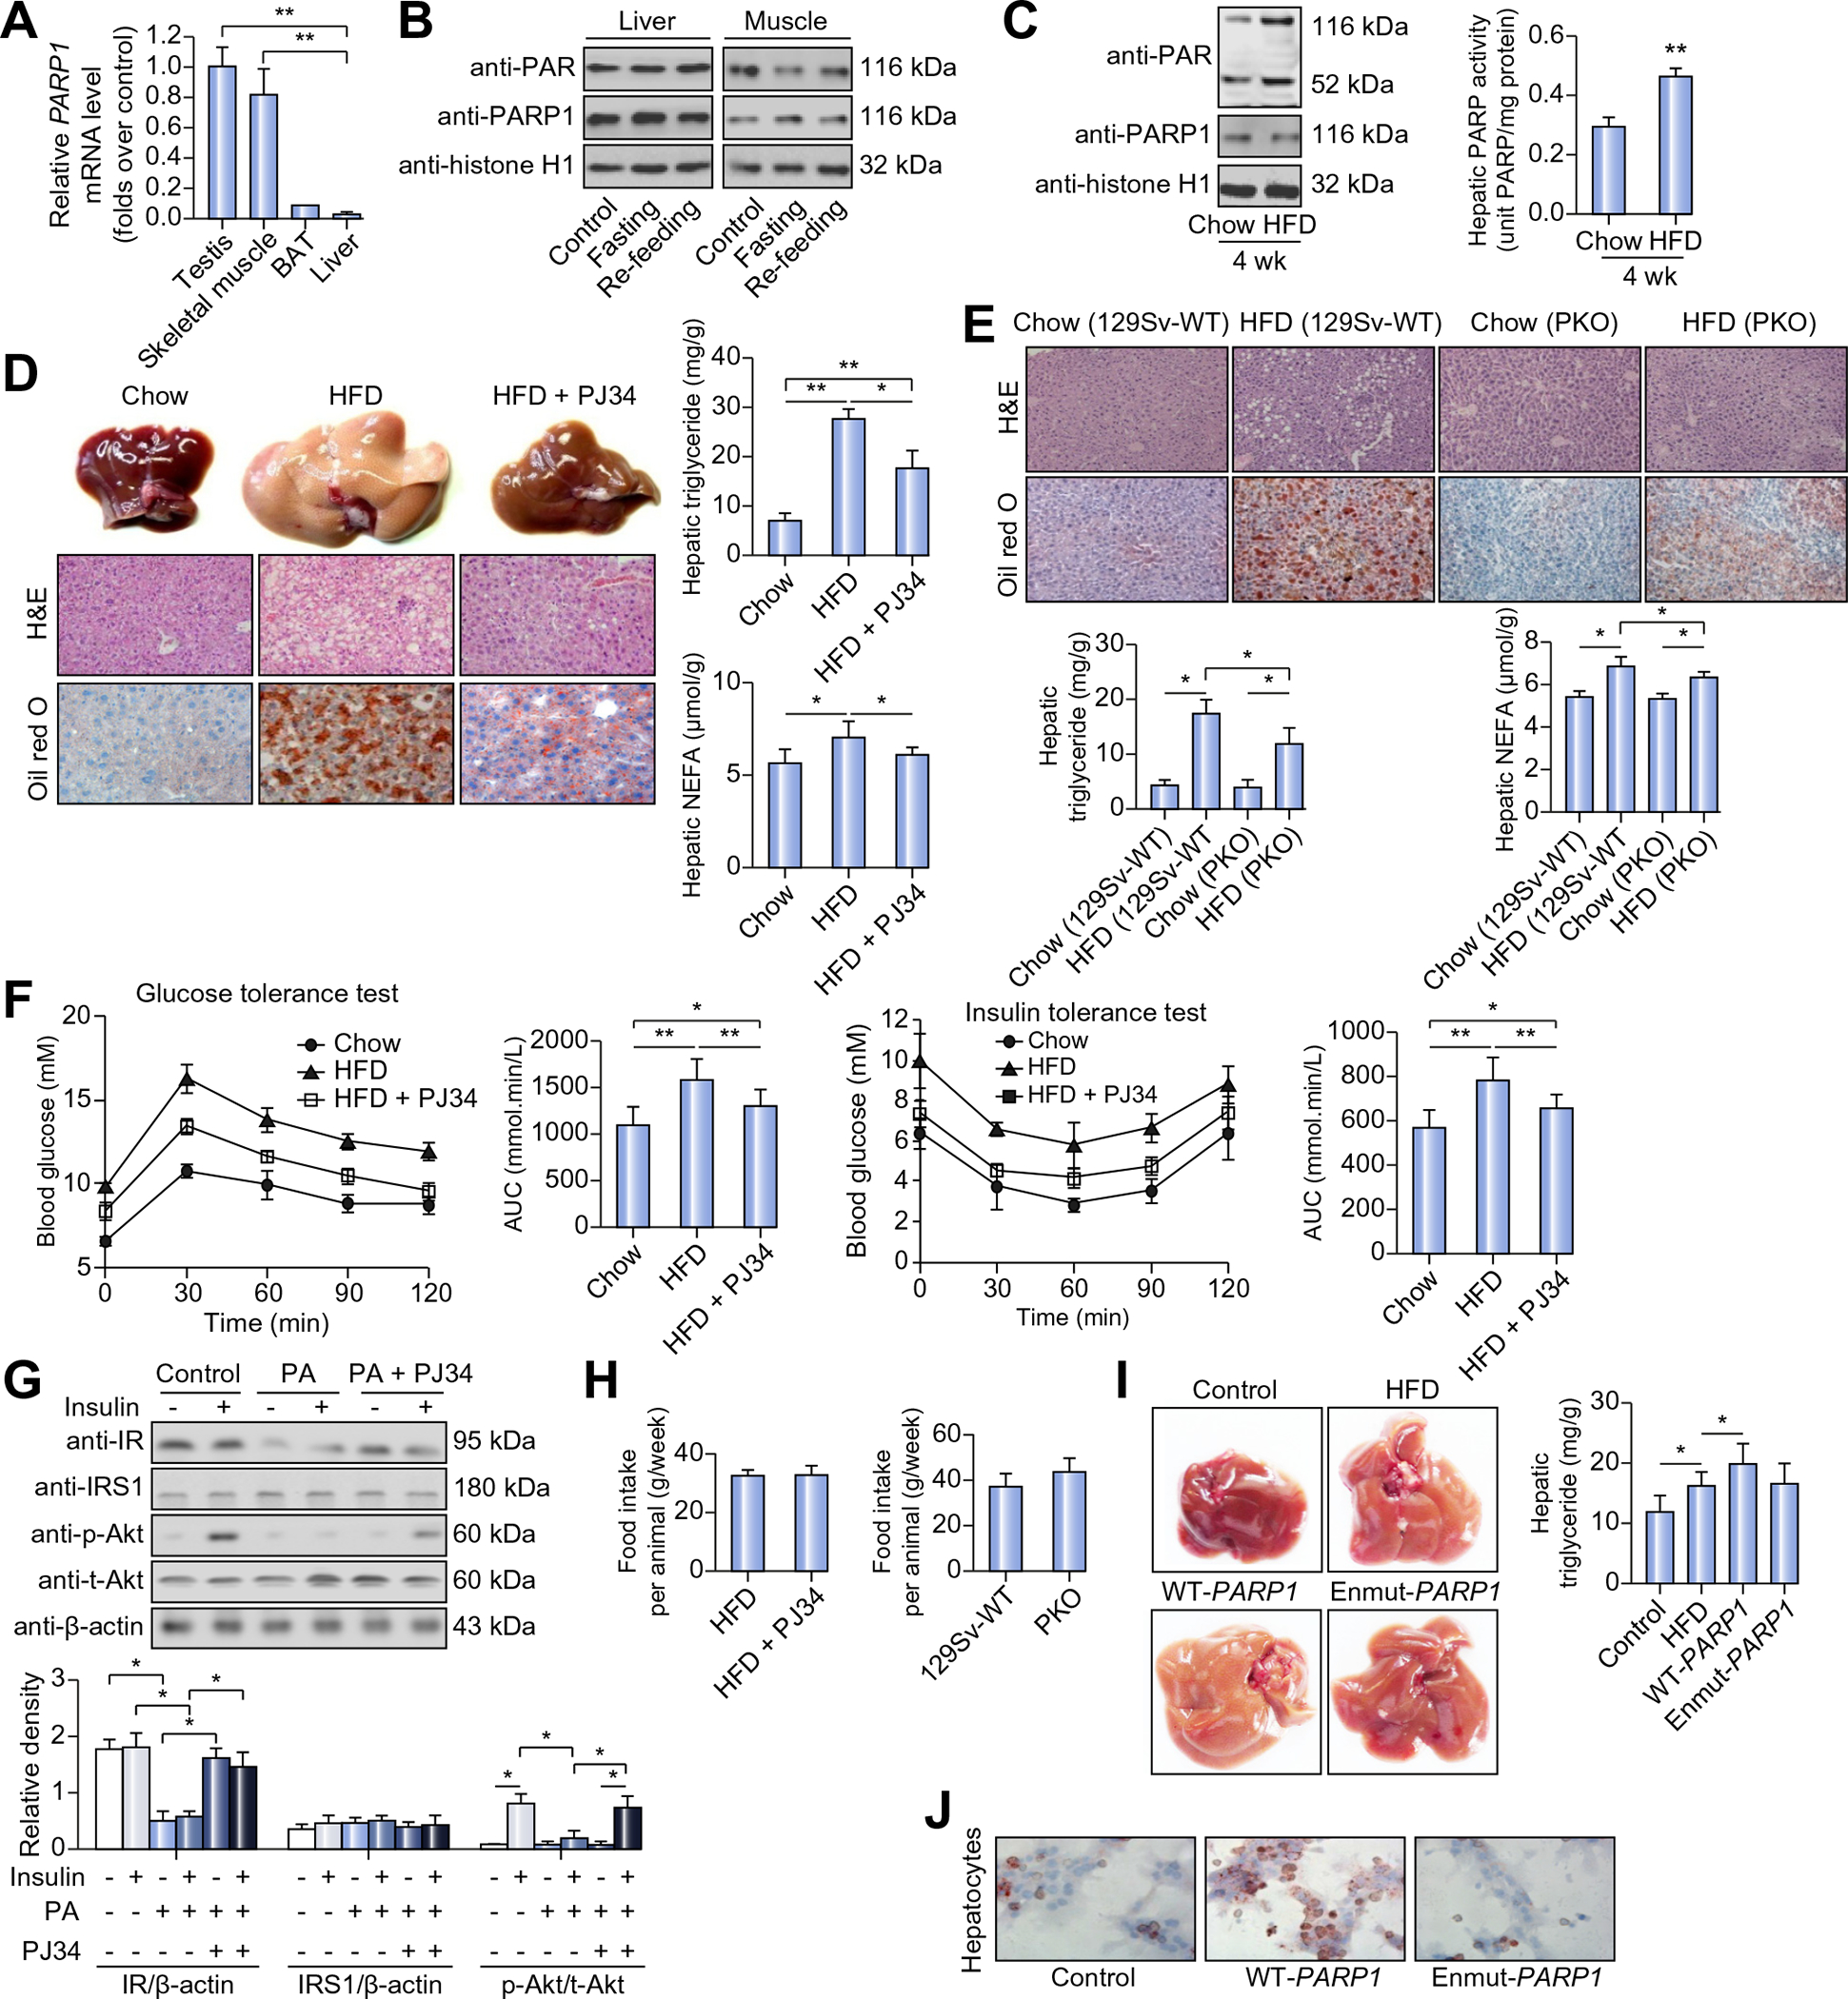
Fig. 1. PARP1 mediates high fat diet (HFD)-induced hepatic steatosis in mice.

(A) PARP1 mRNA expression in C57BL/6 mice. **p <0.05. (B) Poly(ADP-ribosyl)ation levels of PARP1 analyzed by Western blotting, in nuclear extracts from livers and gastrocnemius muscles of mice fed ad libitum, fasted (24 h) or re-fed (24 h) after 24 h fasting. (C) Poly(ADP-ribosyl)ation levels (left) and PARP activity (right) in nuclear extracts from livers of mice fed with chow diet or HFD for 4 weeks. **p <0.01 represents HFD group vs. chow group. (D) C57BL/6 mice were fed with chow diet or HFD for 12 weeks, or fed with HFD for 12 weeks in combination with 10 week-PJ34 injection (10 mg/kg/day, n = 8 each). Representative photographs of liver samples were shown. Hematoxylin and eosin (H&E) and Oil Red O staining of liver sections were analyzed (original magnification: 40×). Triglyceride and NEFA concentrations in livers were analyzed. *p <0.05, **p <0.01. (E) 129Sv-WT or PARP1−/− (PKO) mice were fed with chow diet or HFD for 8 weeks. H&E and Oil Red O staining of liver sections were analyzed (original magnification: 40×. n = 8 each). Triglyceride and NEFA concentrations in livers were analyzed. *p <0.05. (F) C57BL/6 mice were fed with chow diet or HFD for 12 weeks, or fed with HFD for 12 weeks in combination with 10 week-PJ34 injection (10 mg/kg/day). A glucose tolerance test (1 g/kg body weight, glucose intraperitoneal injection) and an insulin tolerance test (0.75 units/kg body weight, insulin intraperitoneal injection) were performed (n = 8 each). The corresponding area under the curve (AUC) of blood glucose levels in each group was calculated. *p <0.05, **p <0.01. (G) Western blotting analysis of insulin receptor, IRS1, Akt and phosphorylated Akt expression in hepatocytes treated with vehicle or PJ34 (10 μmol/L, 24 h) in the absence or presence of palmitic acid (PA, 30 μmol/L, 24 h) or/and insulin (100 nM, 30 min). *p <0.05. (H) Food intake was monitored during HFD feeding. (I) C57BL/6 mice were infected with an adenovirus vector containing the wild-type human PARP1 gene (WT-PARP1) or mutant PARP1 gene lacking enzymatic activity (enmut-PARP1), and fed on HFD or chow diet for 7 weeks (n = 7 each). Representative photographs of liver samples were shown. Triglyceride concentrations in livers were analyzed. *p <0.05. (J) Oil Red O staining of hepatocytes transfected with WT-PARP1 or enmut-PARP1 construct (original magnification: 200×). Data are expressed as the mean ± SEM. One-way ANOVA followed by Student-Newmann-Keuls multiple comparison tests was used for all statistical analyzes.
