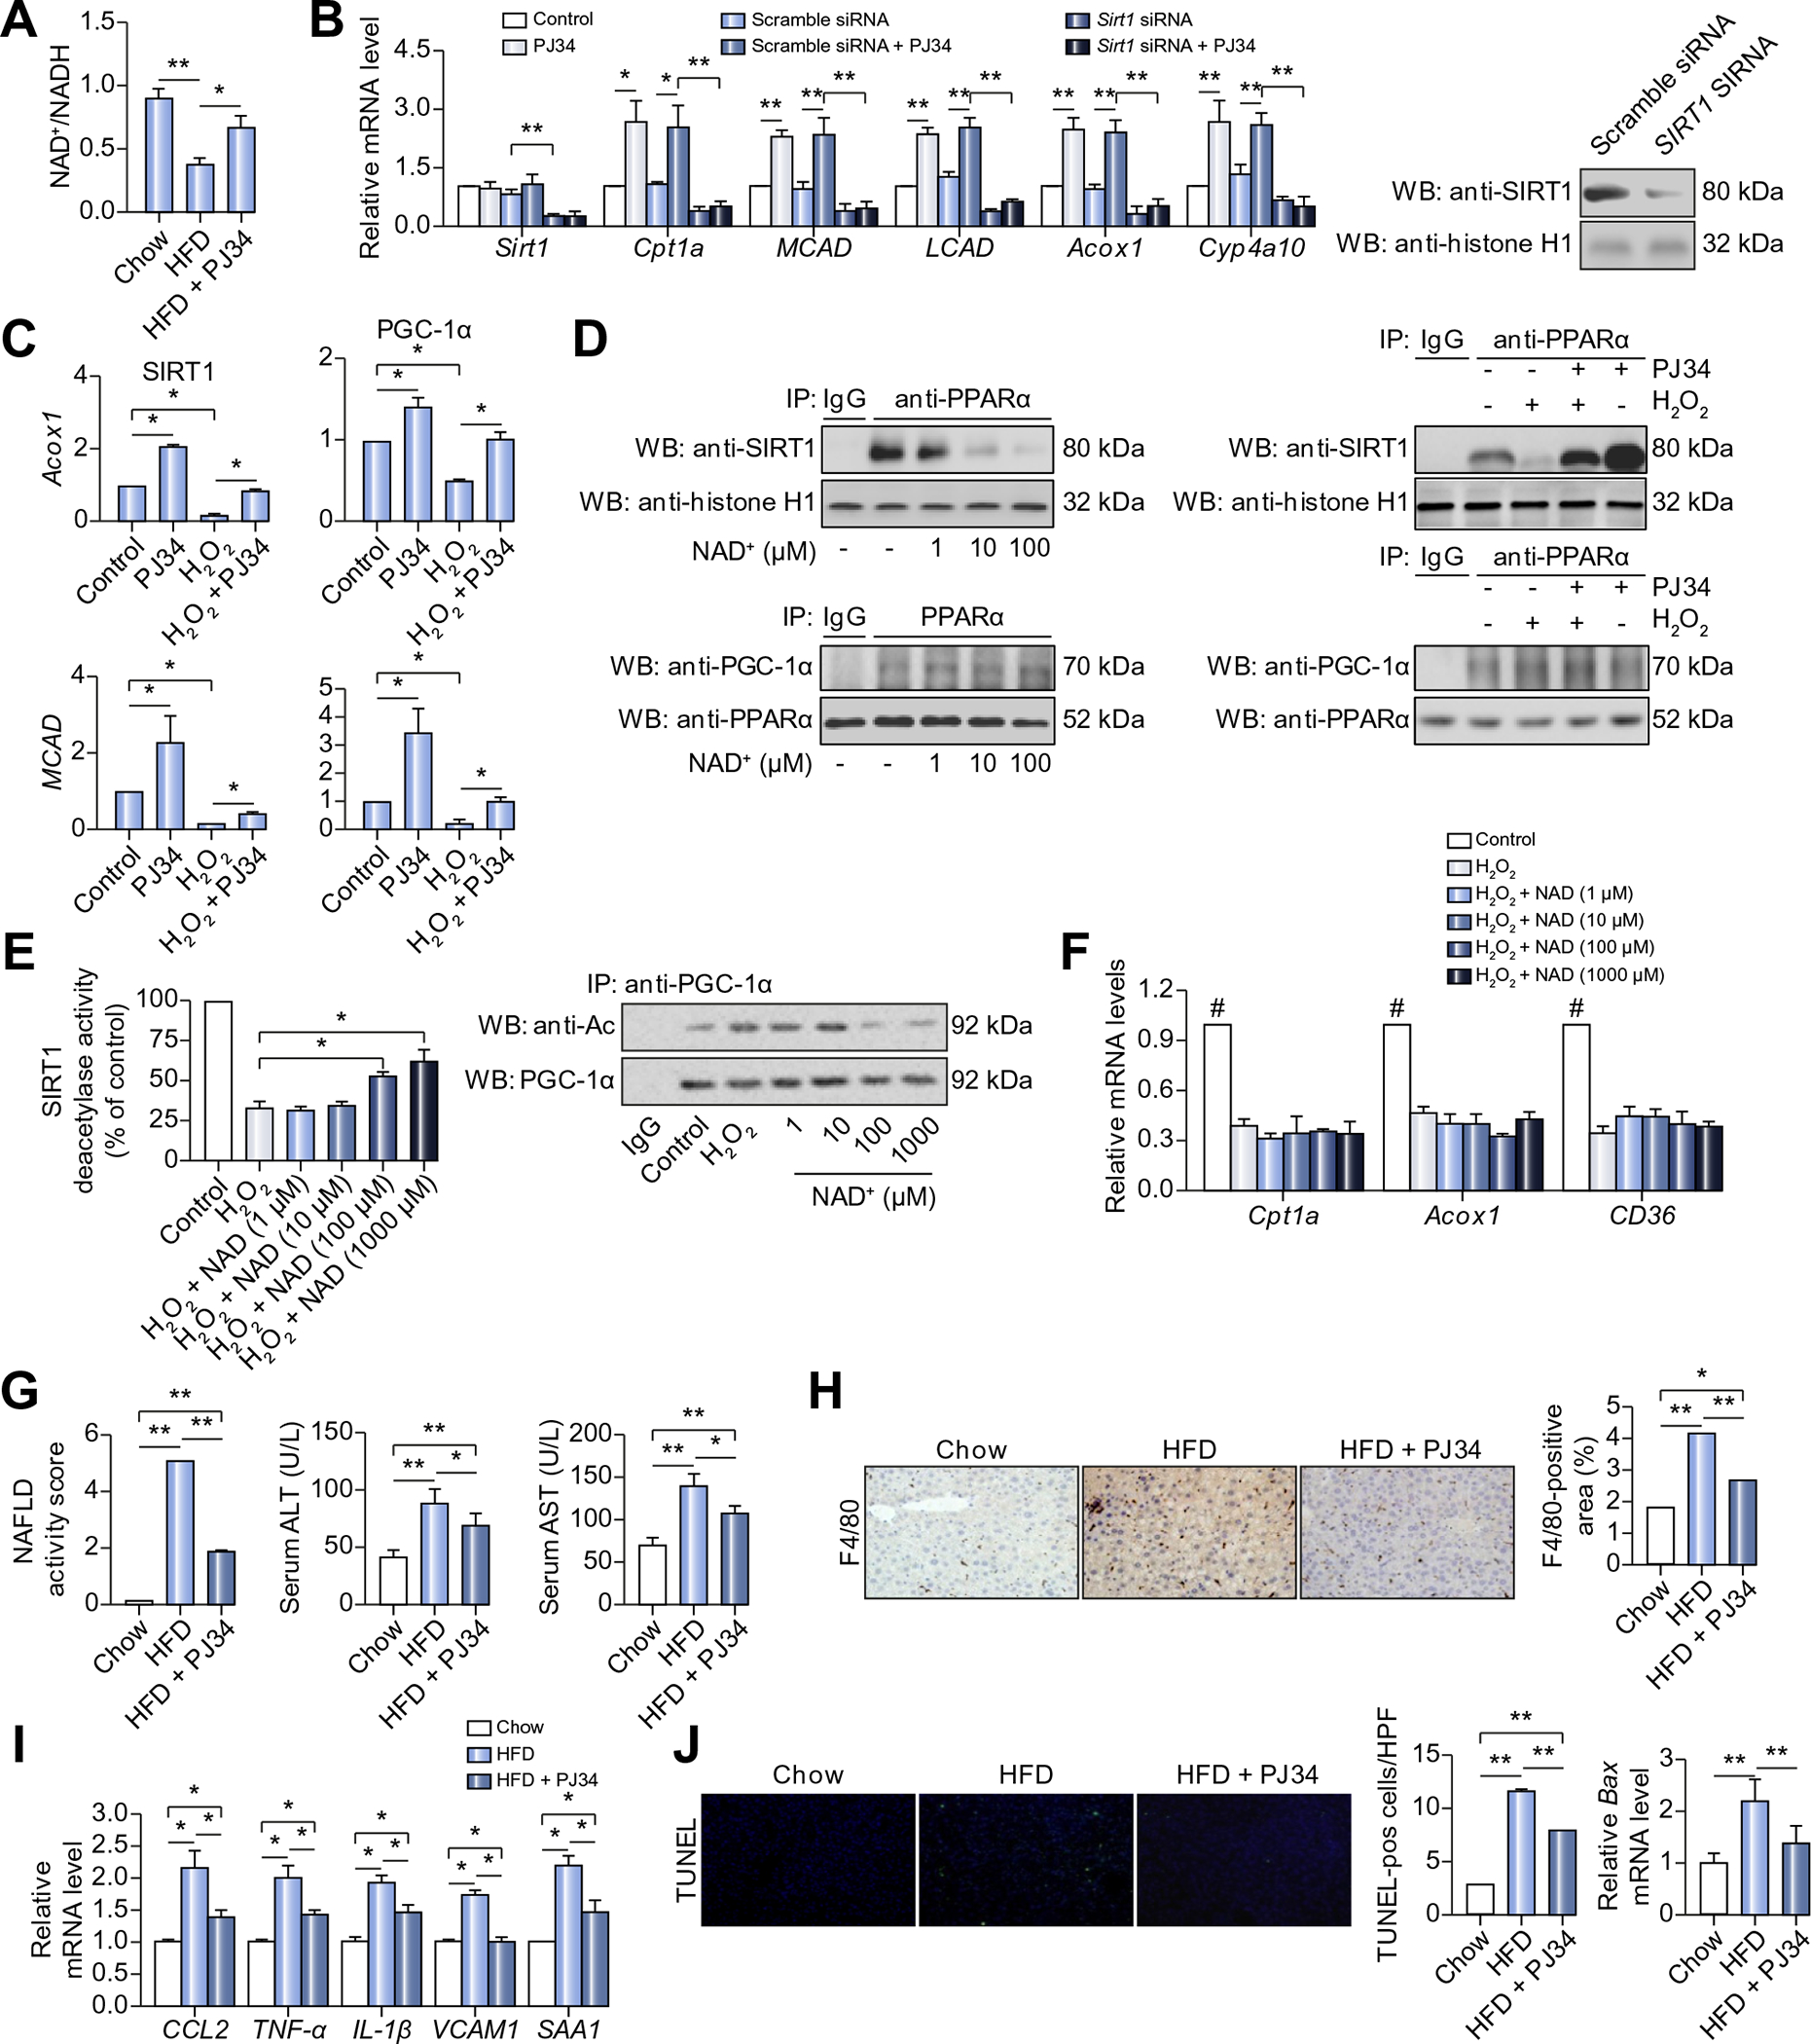
Fig. 5. Poly(ADP-ribosyl)ation suppresses the association of PPARα with SIRT1.

(A) C57BL/6 mice were fed with chow diet or HFD for 8 weeks, or fed with HFD for 8 weeks in combination with 6 week-PJ34 injection (10 mg/kg/day, n = 8 each). NAD+/NADH ratio in liver of mice was measured. *p <0.05. (B) mRNA levels of genes in hepatocytes transfected with Sirt1 siRNA (50 nmol/L, 48 h) or scramble siRNA, followed by treatment with vehicles or PJ34 (10 mol/L, 24 h), (n = 3). *p <0.05, **p <0.01. (C) ChIP assays using anti-Sirt1 antibody or anti-PCG-1α for amplification of Acox1 or MCAD promoters in HepG2 cells treated with vehicles or H2O2 (0.3 mmol/L, 2 h) after pretreatment with PJ34 (10 mol/L, 24 h) (n = 3). *p <0.05. (D) Nuclear extracts from HepG2 cells were subjected to IP assay with anti-PPARα antibody, followed by Western blotting using anti-Sirt1 antibody or anti-PGC-1α antibody. HepG2 cells was treated with different concentration of NAD+, or treated with vehicles or H2O2 (0.3 mmol/L, 2 h) after pretreatment with PJ34 (10 mol/L, 24 h). Non-specific IgG served as a negative control. (E) SIRT1 deacetylase activity was analyzed in HepG2 cells treated with in different concentration of NAD+, in the presence or absence of H2O2 (0.3 mmol/L, 2 h) (left), (n = 4). *p <0.05. Nuclear extracts from HepG2 cells were subjected to IP assay with anti-PGC1α antibody, followed by Western blotting using anti-acetylation (Ac) antibody (right). (F) mRNA levels of genes in HepG2 cells treated with different concentration of NAD+, (n = 4). #p <0.05 represent control group vs. H2O2 group. (G-J) C57BL/6 mice were fed with chow diet or HFD for 12 weeks, or fed with HFD for 12 weeks in combination with 10 week-PJ34 injection (10 mg/kg/day, n = 8 each). (G) NAFLD activity score (NAS), and serum levels of alanine transaminase (ALT) and aspartate transaminase (AST) in mice. *p <0.05, **p <0.01. (H) Liver sections from mice were immunohistochemically stained with anti-F4/80 antibody. *p <0.05, **p <0.01. (I) mRNA levels of the indicated genes in livers of mice were analyzed. *p <0.05, **p <0.01. (J) TUNEL staining of liver sections, and mRNA expression of Bax in the liver were analyzed. *p <0.05, **p <0.01. Data are expressed as the mean ± SEM. One-way ANOVA followed by Student-Newmann-Keuls multiple comparison tests was used for all statistical analyzes.
