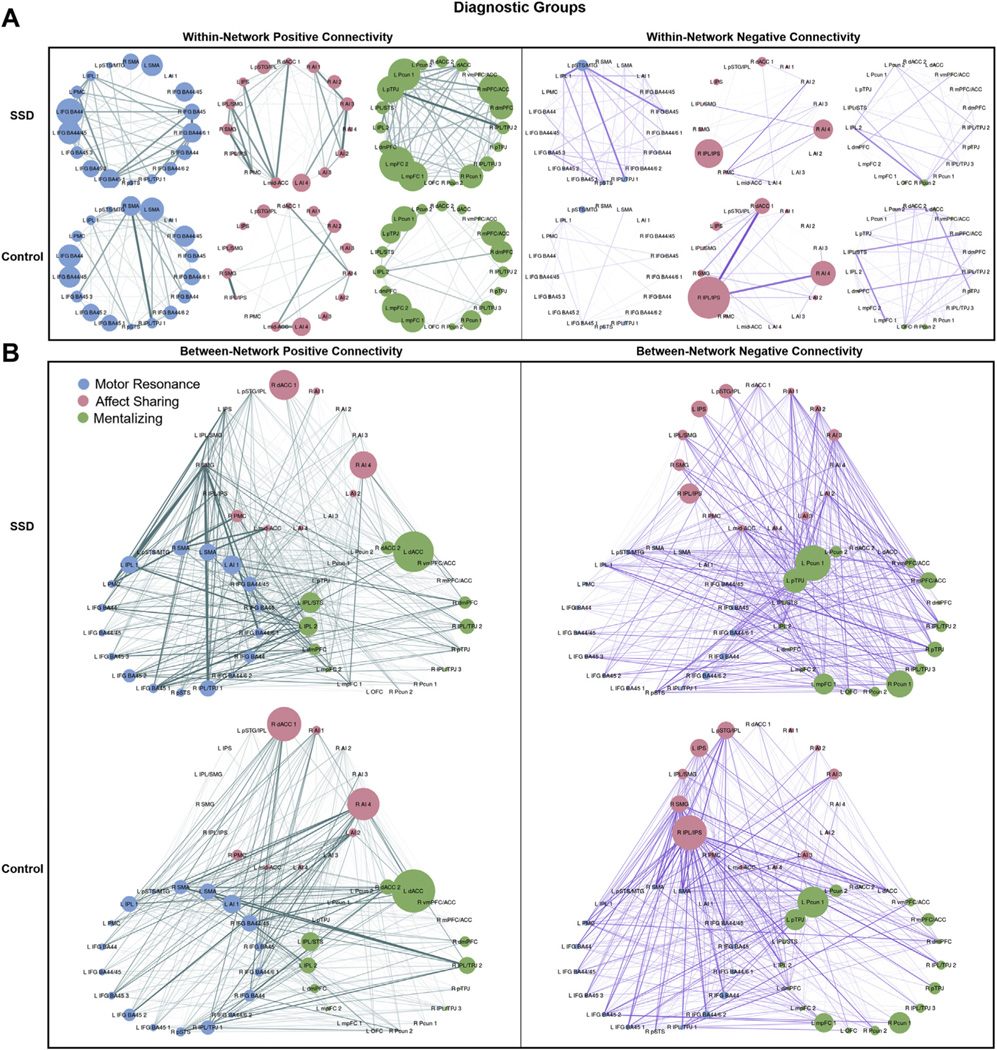
Figure 5.

Positive and negative within- and between-network connectivity strengths by diagnostic group. Connectivity strengths for schizophrenia spectrum disorder (SSD) and control groups are shown. Edge width corresponds to the between-group difference in connection weight. (A) Within-network positive (left) and negative (right) connectivity strengths for motor resonance, affect sharing, and mentalizing networks. Node size corresponds to the within-network connectivity strength of the node (sum of within-network connections to the node). (B) Between-network positive (left) and negative (right) connectivity strengths for motor resonance, affect sharing, and mentalizing networks. Node size corresponds to the between-network connectivity strength of the node (sum of between-network connections to the node). See Figure 1 for abbreviations
