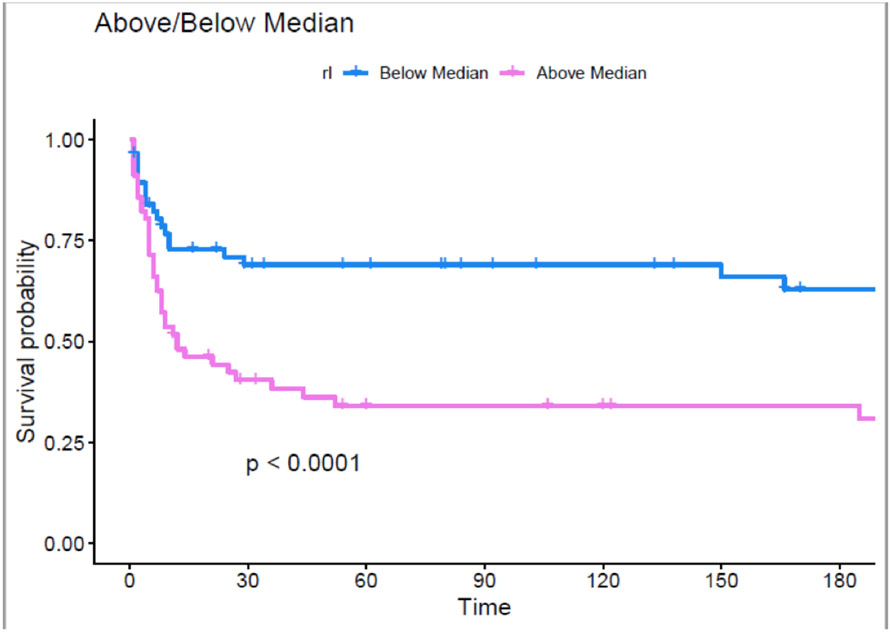
Fig. 2. Kaplan-Meyer curve of RAVI/LAVI of patients above and below the median with time measured in days.
The purpose of this figure is to demonstrate the difference in freedom from death or LVAD when stratified by median RAVI/LAVI. Kaplan Meier curves were used to assess the variance in survival probability for those above and below the median. As demonstrated by the figure, there is a significant difference in outcomes when stratified by the median RAVI/LAVI.

