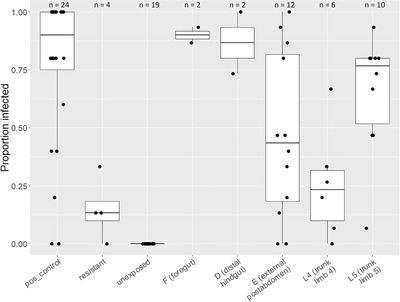
Figure 2.

Boxplot showing proportion of infected hosts resulting from Pasteuria ramosa spore attachment to various sites on Daphnia magna cuticle. Box edges denote first and third quartiles, and whiskers extend to 1.5 × interquartile range. Points represent host clone–parasite isolate combinations, with 15 host individuals (for the resistant group and test groups F–L5) or five host individuals (for positive control and unexposed groups) tested per combination. Number of combinations tested (n) are given above each treatment group. For the test groups (F–L5), we specifically chose host–parasite combinations that show strong attachment at only the site being tested. For the positive control group, each tested P. ramosa isolate was paired with the host in which it was previously propagated. For the resistant group, we tested host–parasite combinations which showed no attachment at all sites.
