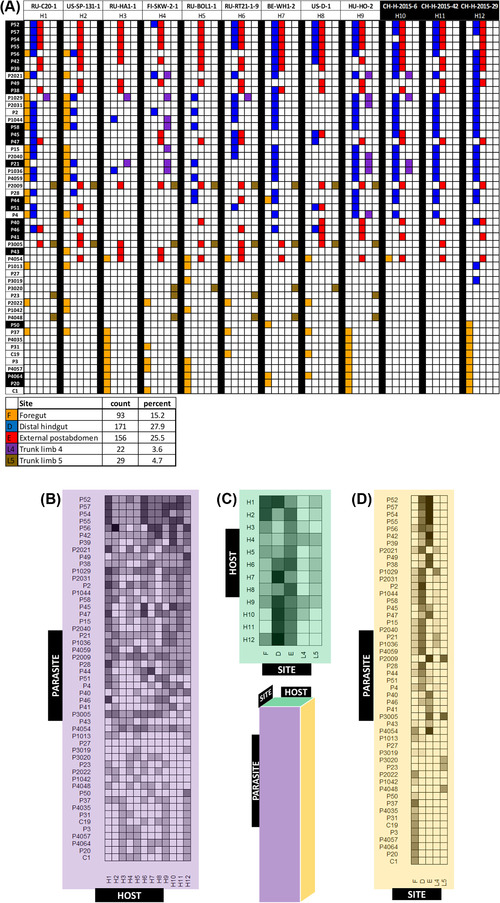
Figure 3.

Parasite–host predicted infectivity matrices. (A) Binary attachment results (infective vs noninfective) for 51 Pasteuria ramosa isolates, 12 host clones, and five attachment sites. Parasite duplicates and attachment sites that did not lead to infection (see Fig. 2) were removed. Each colored square represents an attachment test for which >50% of tested host individuals showed attachment. Parasite isolates are sorted from top to bottom according to their order along principal component 1 (see Fig. 4). Host and parasite labels with white text on black background indicate samples from the Aegelsee population in Switzerland. Matrix was generated using the R package plot.matrix, version 1.4 (Klinke 2020). The summary table below the matrix shows counts and percentages of positive attachment at each site. (B–D) Consensus matrices representing two‐dimensional versions of the full three‐dimensional (parasite × host × site) matrix in (A), with mean attachment scores calculated across each axis. Each cell is shaded according to the proportion of positive attachment tests for each given combination. (B) Parasite–host consensus matrix (mean across attachment sites). Each cell represents one pairing of Daphnia magna clone (columns) and Pasteuria ramosa isolate (rows). (C) Host–site consensus matrix (mean across parasite isolates). Rows represent host clones and columns represent attachment sites. (D) Parasite–site consensus matrix (mean across hosts). Rows represent parasite isolates and columns represent attachment sites.
