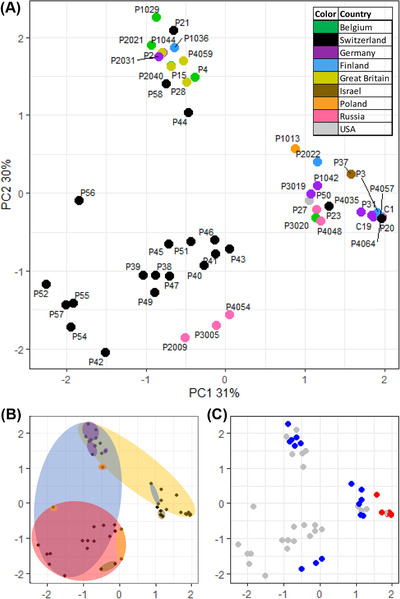
Figure 4.

Parasite isolates cluster by infectotype. (A) Principle component analysis (PCA) plot of P. ramosa infectotypes using quantitative attachment data. Each point represents one of 51 P. ramosa isolates. Proximity along principle component axes 1 and 2 (PC1, PC2) indicates similarity in attachment to five attachment sites on 12 host clones. Colors indicate the country of origin. All points in black indicate the same population in Switzerland. Note that PC1 and PC2 together explain 61% of variation in the overall data, whereas the following PCs explain considerably less variation (PC3: 8%, PC4: 4%, PC5: 4%). Plots (B) and (C) show the data as in (A), but with different aspects highlighted in each. (B) Colored ellipsoids represent the area that encompasses the most points, representing isolates that attach to the given site on the host cuticle (colors as in Fig. 1: yellow = foregut, blue = distal hindgut, red = external postabdomen, purple = trunk limb 4, brown = trunk limb 5). (C) Polymorphism at PCL7 gene: red points denote isolates with the infective PCL7 haplotype, blue points denote isolates with the non‐infective PCL7 haplotype (Andras et al. 2020), and gray points denote isolates for which we do not have genetic data.
