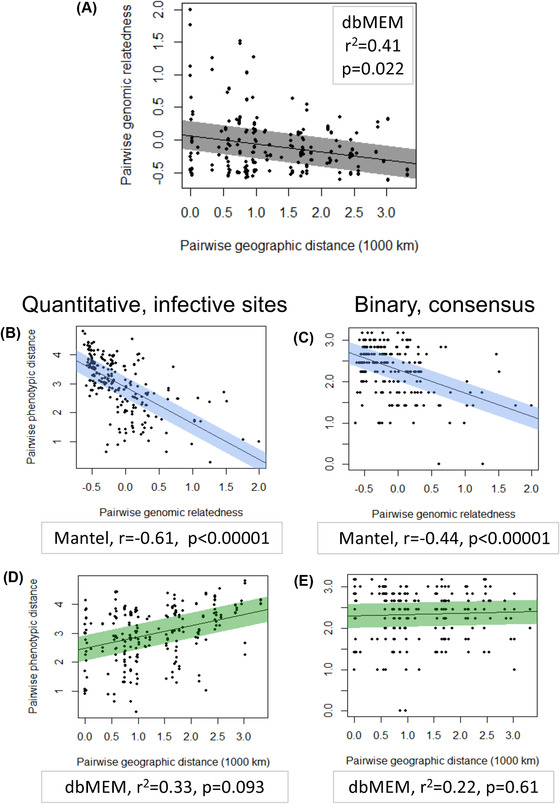
Figure 5.

Distance matrices correlate. (A) Scatterplot showing relationship of pairwise whole genome relatedness (kinship coefficients) to pairwise geographic distances between sites of origin of populations for 22 Pasteuria ramosa isolates from our dataset (see Methods). Line of best fit was generated using a linear model. The shaded region spans 0.5 standard deviation of the residuals on either side of the line. (B‐E) Scatterplots showing relationship of pairwise Euclidean distances between attachment phenotypes to pairwise whole genome relatedness (B,C, blue shading) and to pairwise geographic distances between populations of origin (D,E, green). Phenotype is defined either as quantitative attachment to infective sites (B,D, left column) or as binary infectivity to each host regardless of attachment site (C,E, right column, data as in Supporting information Fig. S8). For each plot, the corresponding test, test statistics and p‐value is given.
