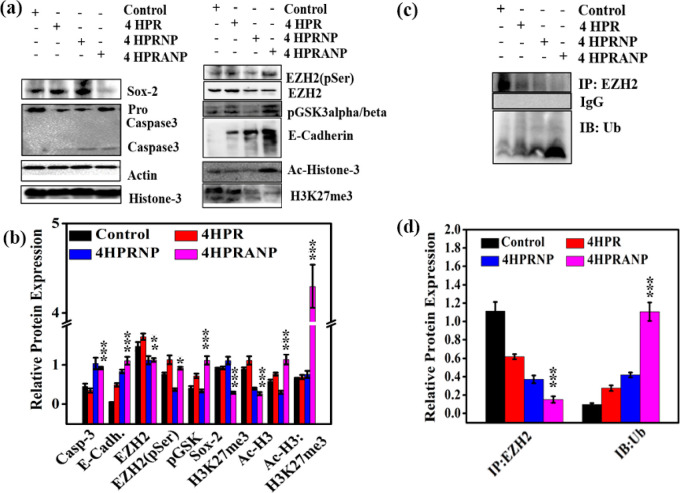
Figure 7.
(a) Relative protein expression of several molecular markers in different treatment groups, (b) quantitative estimation of the relative protein expression, (c) pull down assay showing EZH2 and Ub interaction, and (d) quantification of pull down assay showing increased expression of ubiquitin in 4HPRNP treated group (n = 3; *p < 0.05, **p < 0.01, and ***p < 0.001 considered significant compared to the control group).

