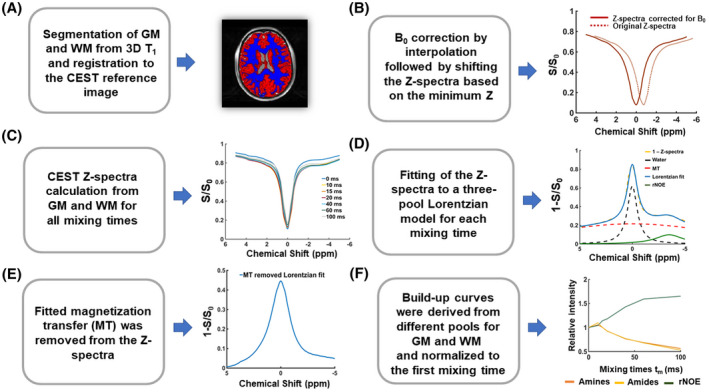
FIGURE 2.

Image processing and analysis. A, Gray matter (GM) and white matter (WM) were segmented from the 3D T1 and registered to CEST space. B, B0 field inhomogeneity corrections were performed by interpolation and shifting of the Z‐spectra based on the minimum z. C, Z‐spectra were plotted for each mixing time from the average signal taken from the voxels in the GM and WM. D, Z‐spectra from all mixing times were fitted to a three‐pool Lorentzian model for GM and WM. E, The MTC pool fitted in step (D) was subtracted from the Z‐spectra. F, VDMP buildup curves were generated for GM and WM for each B1 amplitude, and normalized to the first mixing time. rNOE, relayed nuclear Overhauser enhancement; VDMP, variable delay multipulse
