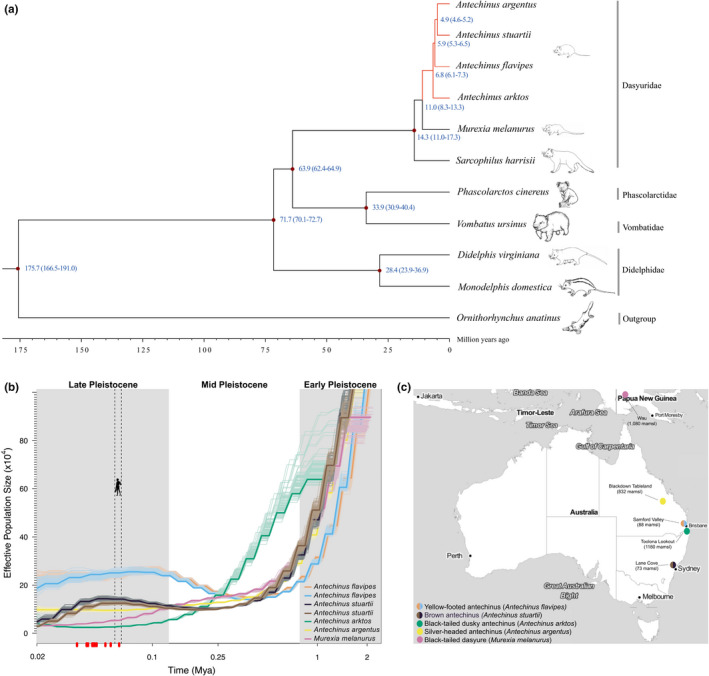
FIGURE 2.

Evolutionary history of semelparous mammals. (a) Inferred phylogeny of ten marsupials and the platypus (outgroup) based on whole‐coding sequences of 6090 1:1 orthologues. Blue numbers at nodes represent the estimated divergence time from present (million years ago; Ma) between lineages. Semelparous lineages are indicated in red. (b) Demography of the dasyurid subfamily Phascogalinae. Historical population sizes (N e) were estimated using the pairwise sequentially Markovian coalescent (PSMC) method (Li & Durbin, 2011) and diploid genome sequences. The x‐axis shows the time before present in years on a log scale; the dashed grey line shows human arrival in Australia 59.3–65 ka (Clarkson et al., 2017); red dots indicate the extinction times of 15 species of Pleistocene Sahul (Saltre et al., 2016). The y‐axis shows N e, with bootstrap estimates indicated by lighter lines. Plots were scaled using a mutation rate (μ) of 1.37 × 10⁻⁹ substitutions per nucleotide per generation and species‐specific generation times (g) of 1 year. Two Antechinus flavipes (coloured in orange and blue) and two Antechinus stuartii (in brown and black) individuals were interrogated. (c) Map showing the location (coloured circles) and elevation (m amsl; metres above sea level) of sampled dasyurids (see panel b)
