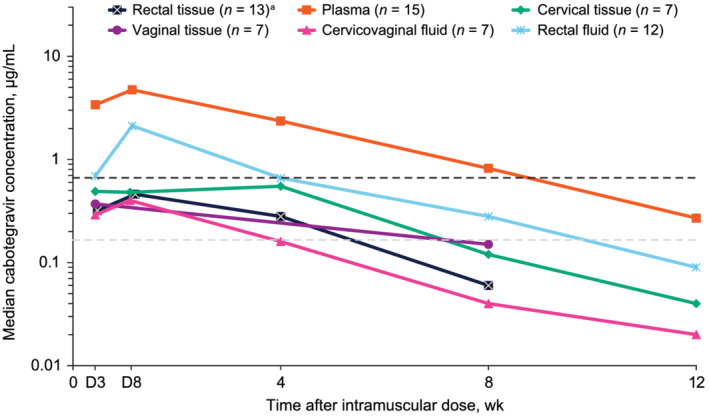
FIGURE 1.

Median cabotegravir concentration–time profiles presented by matrix following a single, ultrasound‐guided cabotegravir LA 600‐mg intramuscular gluteal injection. Black and grey dashed lines indicate 4× PA‐IC90 = 0.664 μg/mL and PA‐IC90 = 0.166 μg/mL, respectively. Plasma LLOQ = 0.025 μg/mL; fluid LLOQ = 0.0000625 μg/mL; tissue LLOQ = 0.00005 μg/mL. D, day; LA, long‐acting; LLOQ, lower limit of quantification; PA‐IC90, in vitro protein‐adjusted 90% maximal inhibitory concentration. a Median rectal tissue concentration at Week 12 was less than tissue LLOQ
