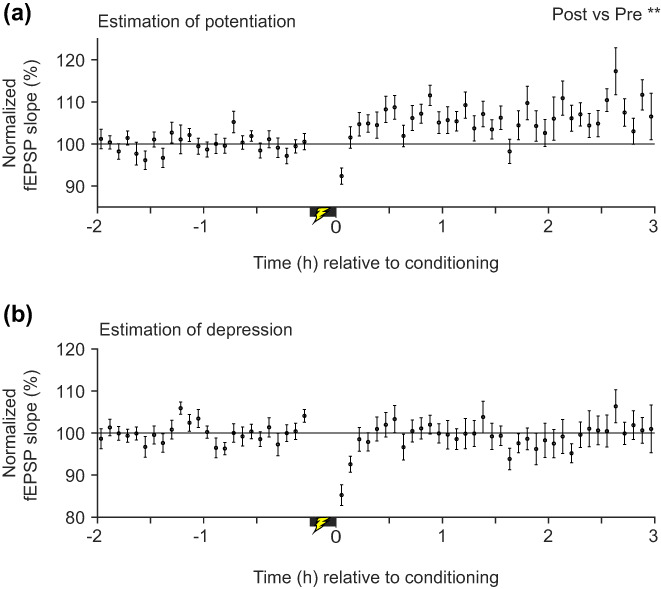
FIGURE 6.

In vivo synaptic strength modifications associated with cFC after taking sleep into account. (a) Average normalized fEPSP slopes from the most potentiated electrodes (n = 24, 1 electrode/mouse) after removing the fEPSP slope data corresponding to sleep episodes (Figure S3). **p < .01, a significant increase in fEPSP slopes in the post‐conditioning period relative to baseline. (b) As in (a) except that least potentiated electrodes (n = 18, 1 electrode/mouse) were used. Error bars: SEM
