Figure 4.

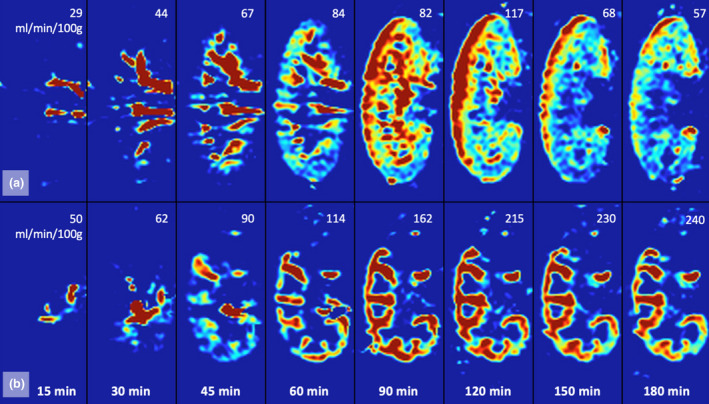
ASL‐derived coronally resliced perfusion map of a porcine (a) and a human (b) kidney over the first 180 minutes of normothermic machine perfusion. In the upper right corners are the corresponding renal perfusion rates in ml/min/100g.

ASL‐derived coronally resliced perfusion map of a porcine (a) and a human (b) kidney over the first 180 minutes of normothermic machine perfusion. In the upper right corners are the corresponding renal perfusion rates in ml/min/100g.