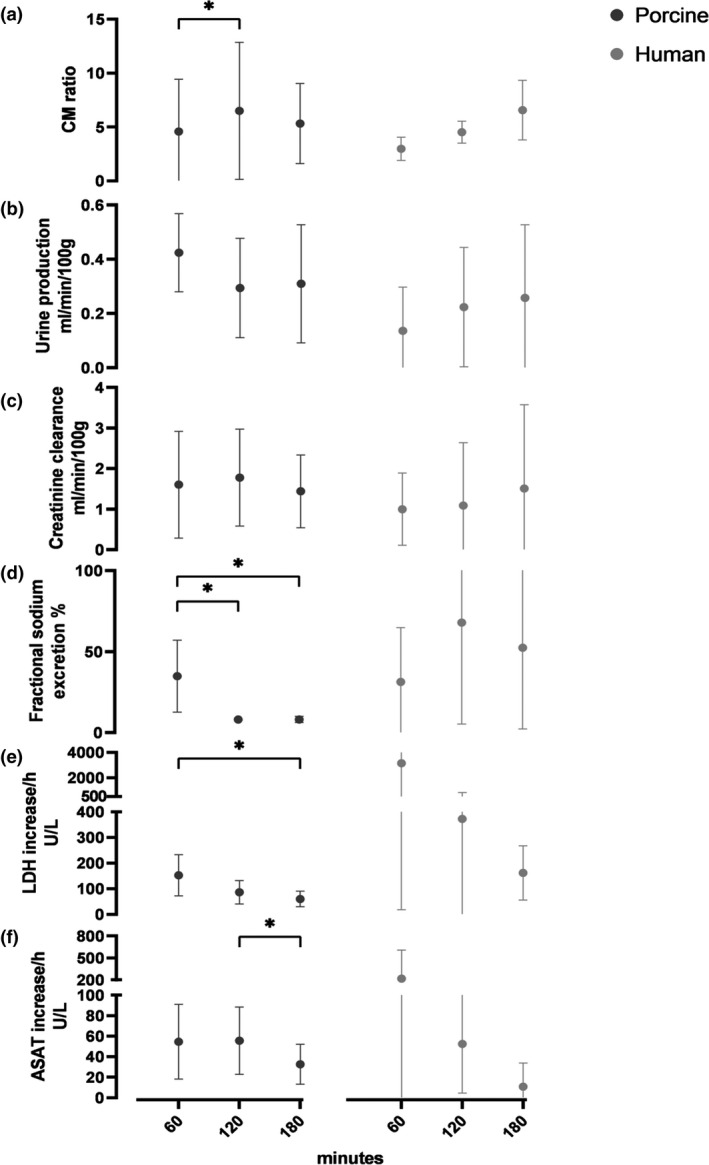
Figure 6.

Renal quality assessment markers of 9 porcine and 4 human discarded kidneys during NMP. Mean (SD). (a) mean corticomedullary ratio from the ASL‐derived perfusion map. (b) urine production per hour. (c) creatinine clearance per hour. (d) fractional sodium excretion per hour. (e) hourly increase of lactate dehydrogenase (LDH). (f) hourly increase of aspartate aminotransferase (ASAT).
