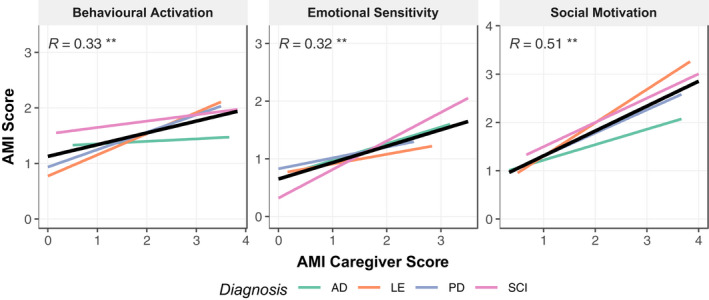
Figure 5.

Correlation between AMI‐CG and AMI subscale scores by patient group. Low correlations between the AMI‐CG and AMI Behavioural Activation subscale. Low and moderate correlations between items of the Emotional Sensitivity subscale and moderate. Correlations between subscales did not hold for all patient groups (see text). AD, Alzheimer's disease; LE, Limbic encephalitis; PD, Parkinson's disease; SCI, Subjective cognitive impairment. *p < .05, **p < .01.
