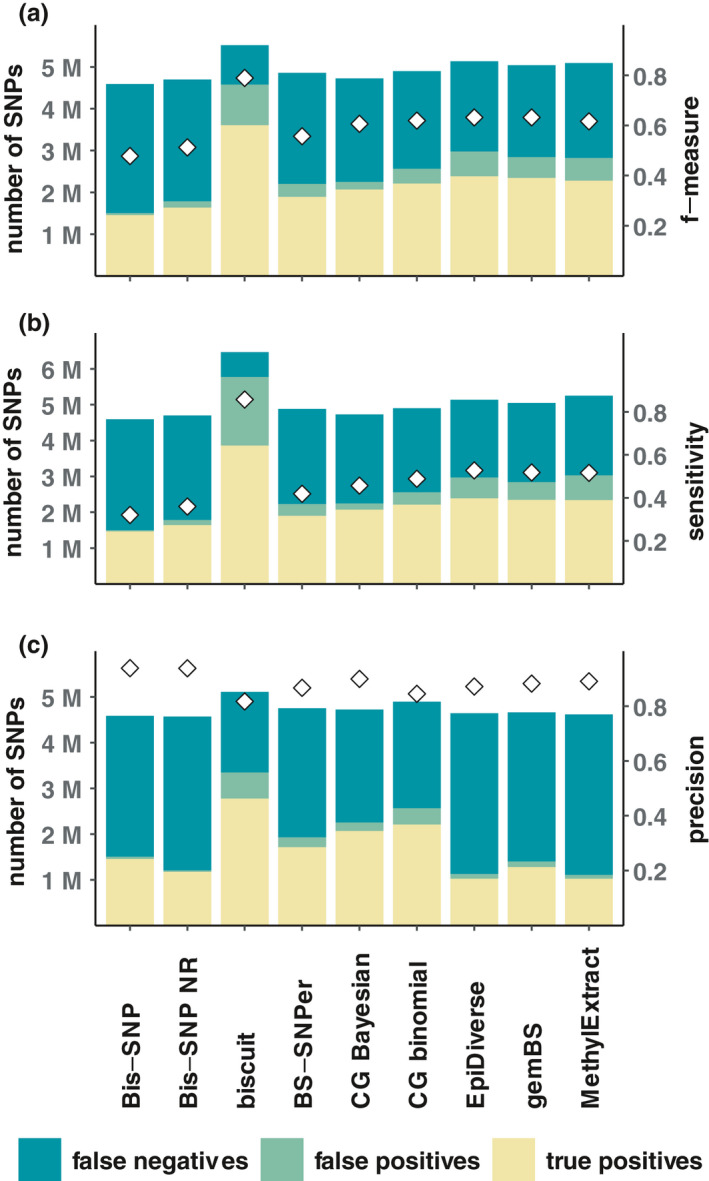
FIGURE 2.

Number of false negative (teal), false positive (green), and true positive (yellow) SNPs called (bars and left y‐axis) with the different tools tested for SNP calling from bisulphite sequencing data for one sample (F3_E_BD_27272). Performance metrics are based on the evaluation with rtgtools and we here show the performance metrics for which the f‐measure (a), sensitivity (b), and (c) precision is maximized when using QUAL as score fields (white diamonds and right y‐axis). Note that the QUAL values for which f‐measure, sensitivity, or precision are maximized differ between tools and that precision is maximized on the condition that at least 1,000,000 SNPs were called. Here, only one sample is displayed, but see Figures S14–16 for plots with all samples
