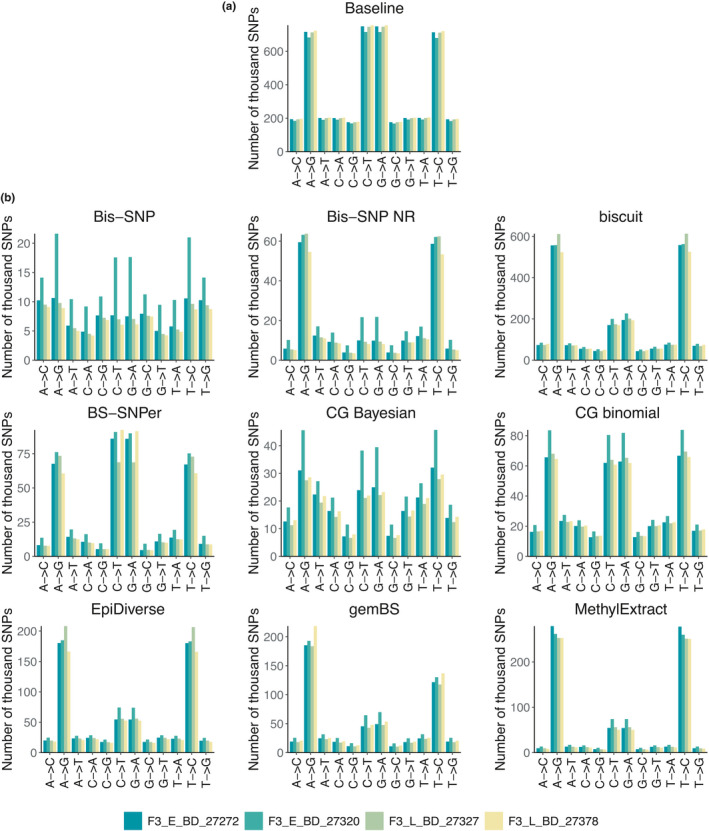
FIGURE 3.

Distribution of SNPs over substitution contexts (alternative and reference allele) for the baseline list of true SNPs derived from whole‐genome resequencing data (a) and the tool‐specific lists of false positive SNPs (b). Samples are differentiated by colour (teal‐yellow) and plots in (b) have tool‐specific plot titles
