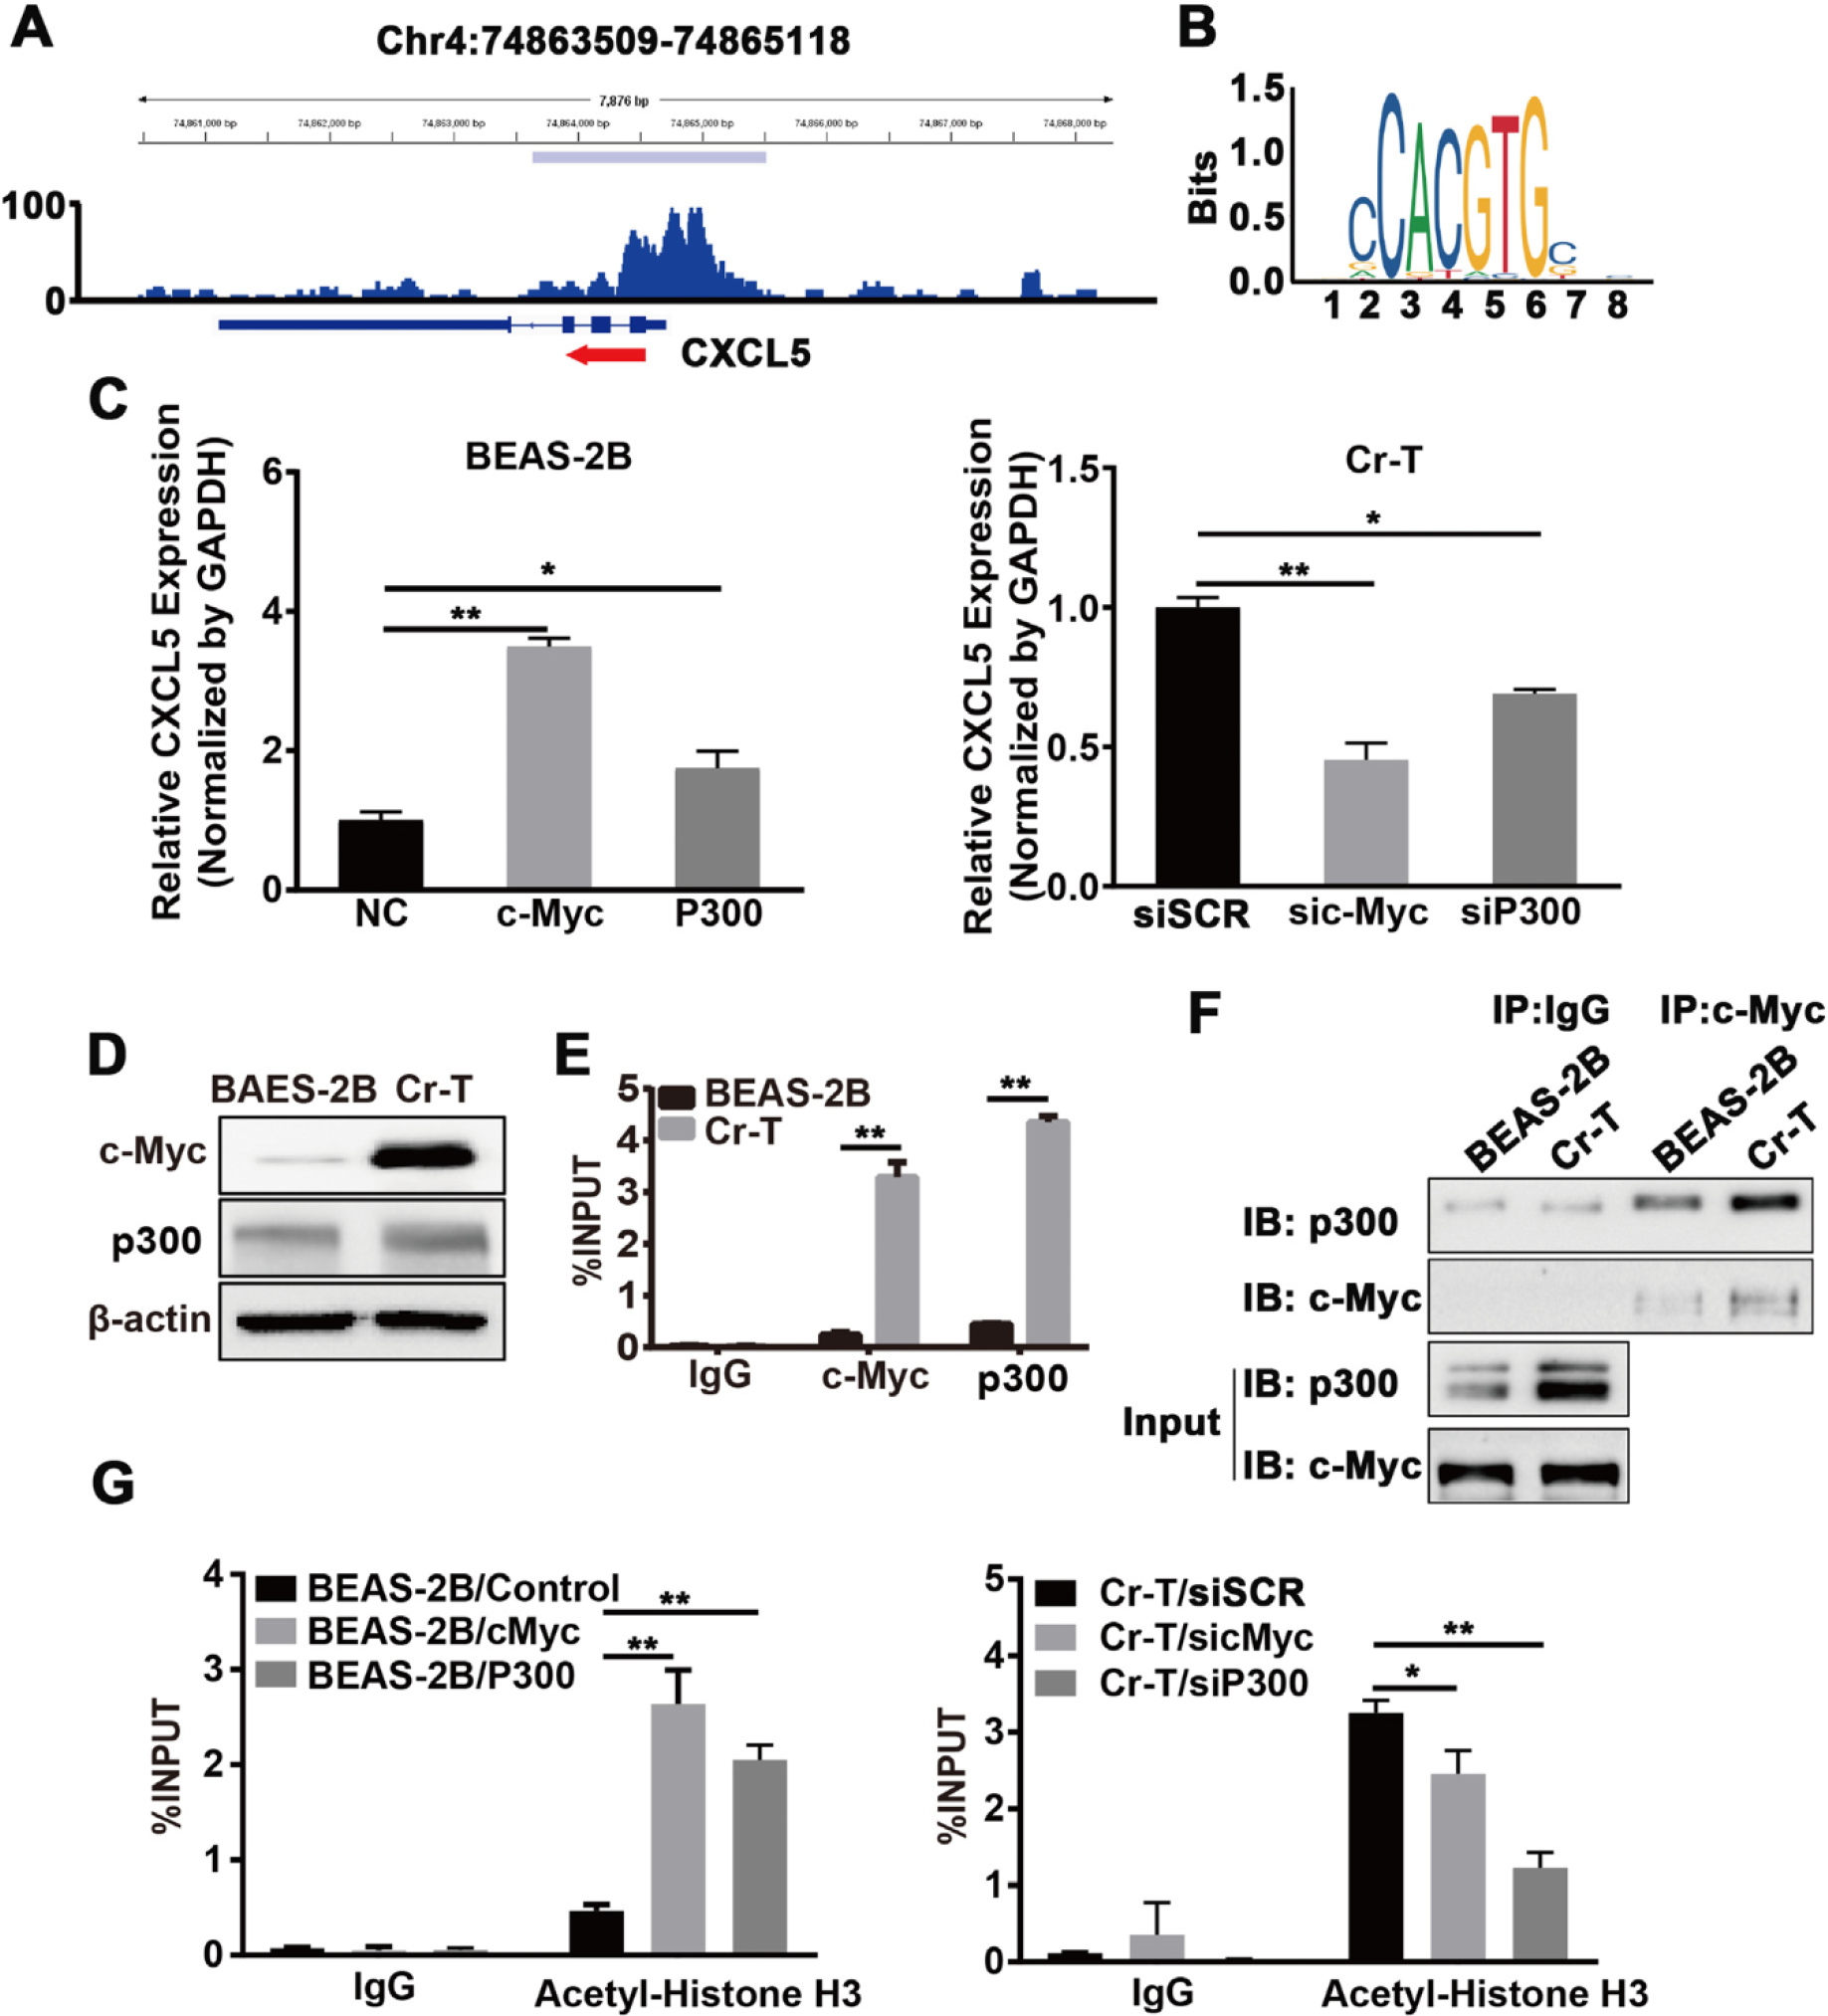
Fig. 5.

C-Myc upregulation increased CXCL5 expression by recruiting p300 and enhancing histone H3 acetylation in Cr-T cells. (A) The GSE31477 GEO dataset was visualized and peaks were called using the Integrated Genomics Viewer (IGV) to predict the binding sites and enrichment intensity of c-Myc in the promoter region of CXCL5. (B) The potential binding motif of c-Myc in the CXCL5 promoter was identified using JASPAR (http://jaspar.genereg.net). (C) B2B cells transfected with pcDNA3 empty vector, pcDNA3-c-Myc, or pcDNA3-p300 (left panel) or Cr-T cells transfected with an siRNA scrambled control (siSCR), an siRNA targeting c-Myc (sic-Myc) or an siRNA targeting p300 (sip300, right panel) were harvested 72 h post transfection for analysis of CXCL5 and GAPDH expression by qRT-PCR. * and **, p < 0.05 and p < 0.01 compared to empty negative control (NC) or siSCR group. (D) c-Myc and p300 protein expression in parental B2B and Cr-T cells using immunoblotting, β-actin was used as a loading control. (E) ChIP assay of the CXCL5 promoter from B2B or Cr-T cells using antibodies against IgG, c-Myc or p300. **, p < 0.01 compared to B2B cells. (F) Co-immunoprecipitation (Co-IP) analysis of whole cell lysates from parental B2B and Cr-T cells using IgG, c-Myc, and p300 antibodies for IP and blotting. 5% of protein input depicted in the bottom panels (G) Histone H3 acetylation in B2B cells overexpressing c-Myc or p300 (as in E) and Cr-T cells silencing c-Myc or p300 was detected using ChIP assay. Data were presented as means ± SEM of three independent experiments. * and **, p < 0.05 and p < 0.01 compared to empty vector control or siSCR group.
