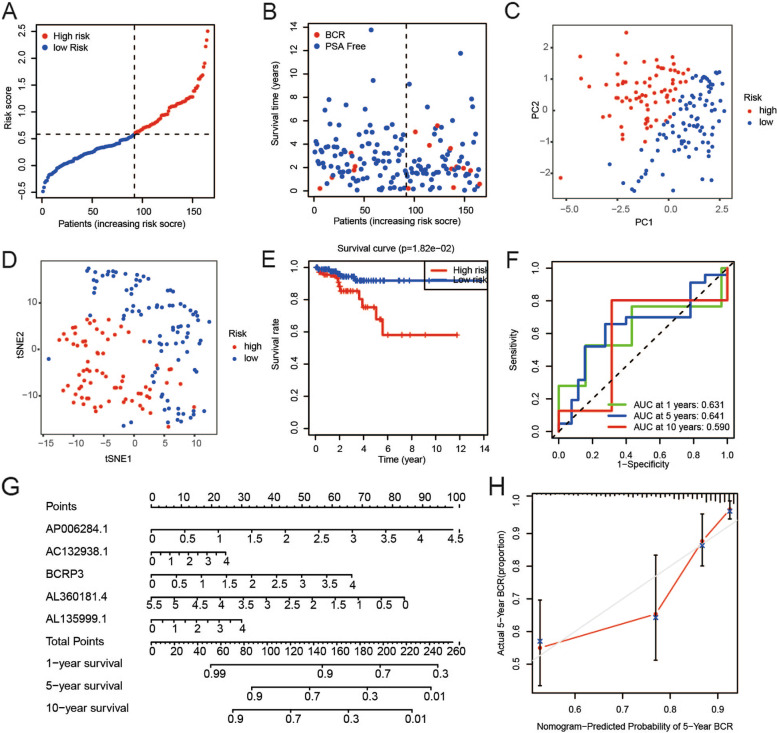
Fig. 4.
Validation of the prognostic model in the verification group. A-B The scatter plots showed that different risk scores indicated different BCR states of PCa patients in the verification group. C-D Effective clustering ability of risk score based on the 5 frlncRNAs in the verification group was shown. E There was a distinct difference in PSA-free survival time between high- and low-risk groups in the verification cohort. F ROC showed the predictive value of risk score for BCR in the verification cohort. G The nomogram was constructed based on the 5 frlncRNAs. H The calibration plot for the prediction of nomogram at 5 years

