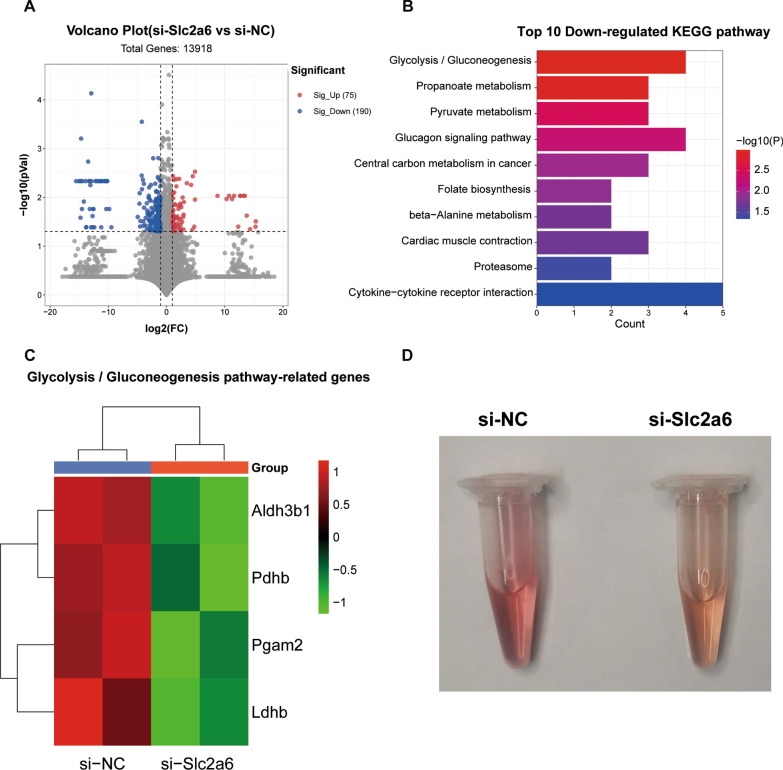
Fig. 4.
Transcriptomics analysis. a The volcano plot displays an overview of the differntially expressed genes (DEGs) between si-NC and si-Slc2a6 group. The X-axis represents the log-transformed p-value, and the Y-axis indicates the multiple of the DEGs. The gray dots represent the DEGs that are not differentially expressed, the red dots represent the upregulated DEGs, and the blue dots represent the downregulated DEGs. |Log2 Fold Change| > 1 and p < 0.05 were set as the criteria. b The top 10 significantly downrelated KEGG pathways. The X-axis represents the number of DEGs enriched in a pathway. c Heatmap showing the differentially expressed genes involved in glycolysis/gluconeogenesis pathway. d The color of the culture media was photographed after knocking down Slc2a6. All the data are expressed as mean ± SEM from three separate experiments. *p < 0.05, **p < 0.01, ***p < 0.001, si-NC versus si-Slc2a6 group

