Fig. 5.
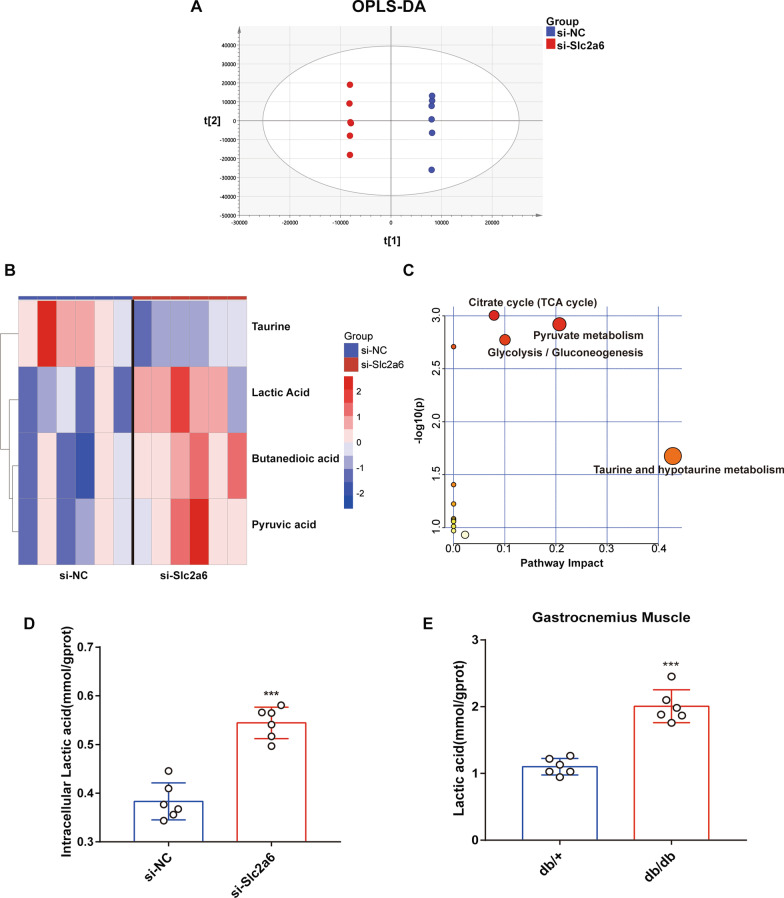
Untargeted metabolomics analysis. a Orthogonal partial least squares-discriminant analysis (OPLS-DA) of the differentially present metabolites, identified via GC–MS, in Slc2a6-knocked-down (si-Slc2a6) versus control (si-NC) C2C12 cells. b Heatmap showing these metabolites (VIP > 1, p < 0.05). The color of each section is proportional to the significance of the change (red, upregulated; blue, downregulated). Rows and columns correspond to the samples and metabolites, respectively. c The metabolic pathways in which the affected metabolites were involved, identified using MetaboAnalyst 5.0. d Intracellular and e gastrocnemius muscle lactic acid (mmol/gprot) levels in db/+ and db/db mice were measured using a lactic acid test kit. All the data are expressed as mean ± SEM from three separate experiments, n = 6 per group. *p < 0.05, **p < 0.01, ***p < 0.001, si-NC versus si-Slc2a6 group

