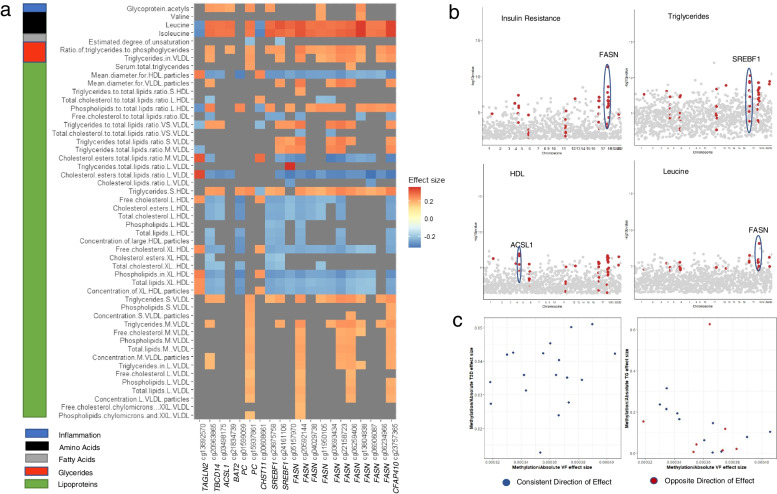
Fig. 5.
Deep functional metabolic phenotype analysis results. a Heatmap showing significant metabolite associations and their effect size from the regression analysis for the 19 VF-DMP CpGs in 9 genes identified in the multi-omic integration (N = 347). Only significant associations are shown, with grey areas reflecting correlations which did not meet the multiple testing significance threshold. Effect sizes for significant associations range from −0.33 to 0.36. b Nominally significant association results from regression analysis for IR (N = 397, 114 cases/284 controls), TG (N = 528), HDL (N = 528) and Leucine (N = 347) with the DNA methylation levels in the 9 genes identified in the multi-omic integration shown in red, in each case the gene containing the most significant result has been highlighted. c Replication results for subsets of the 19 VF-DMP CpGs tested by regression with T2D status (N = 56) in the Nilsson et al. [22] dataset (left), and with TG (N = 199) in the Allum et al. [20] dataset (right)

