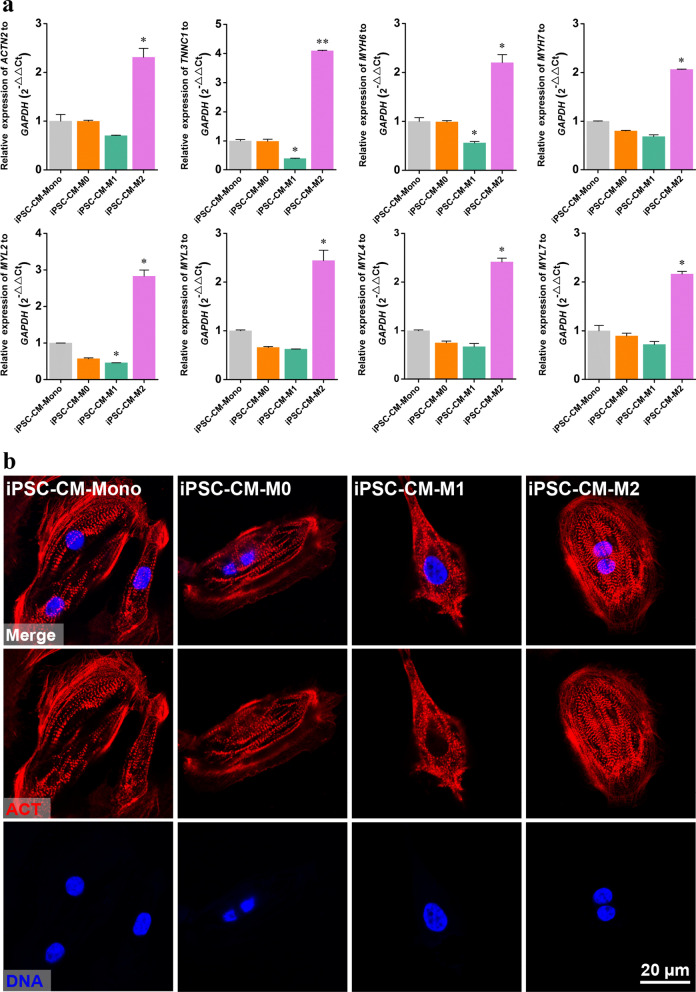
Fig. 4.
Structural maturation of iPSC-CMs co-cultured with M0, M1, or M2 macrophages. a RT-qPCR analysis of the cardiac sarcomeric genes expression. b Fluorescence image of cardiac differentiated iPSC cultures co-cultured with M0, M1, or M2 macrophages immunostained for α-actinin (red). Cell nuclei were counterstained with Hoechst 33,342 (blue). mRNA levels are shown relative to those of M0 macrophage, which were set at 1. Data are presented as mean ± SEM, N = 3 individual preparations. Statistics were done by one-way ANOVA test with Bonferroni correction. *P < 0.05

