


Figure 2.
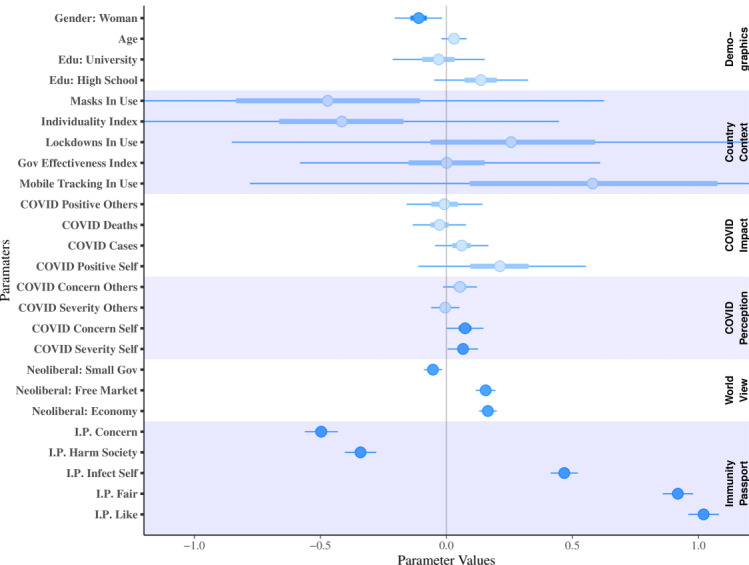
Bayesian generalized linear mixed effects model of immunity passport support (post immunity passport questions) across countries. Positive parameters display immunity passport support; negative values display a decrease in support. Bars represent 50% of the parameter distribution centered on the parameter mean and tails display the 95% highest density interval. Opaque variables show instances where the posterior interval does not overlap zero. IP: immunity passport.