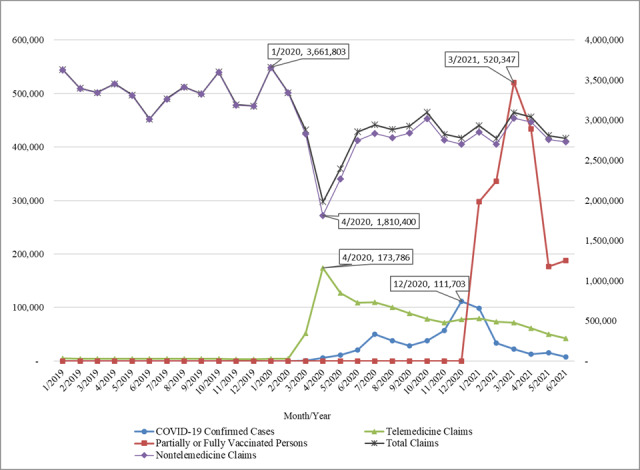
Figure 2.

Overview of monthly COVID-19 cases, vaccination, and telemedicine usage in Alabama. The “Total Claims” and “Nontelemedicine Claims” series are plotted on the right-hand axis, while the other data series are plotted on the left-hand axis.

Overview of monthly COVID-19 cases, vaccination, and telemedicine usage in Alabama. The “Total Claims” and “Nontelemedicine Claims” series are plotted on the right-hand axis, while the other data series are plotted on the left-hand axis.