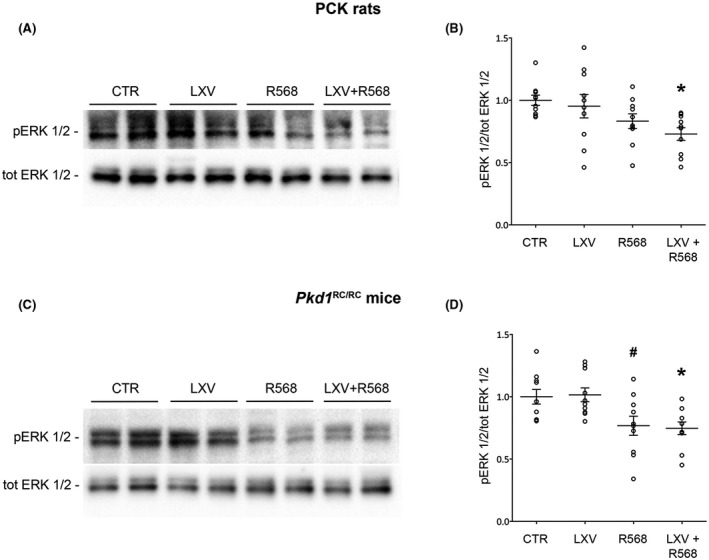
FIGURE 3.

ERK phosphorylation levels in PCK rats and Pkd1 RC/RC mice. (A–C) Representative blots for total ERK1/2 or ERK1/2 phosphorylated at Thr185/Tyr187 (pERK 1/2). (B) Densitometric analysis and statistical studies (means ± SEM) in PCK rats (n = 10, 5 animals per group and gender), *p < .01 versus CTR. (D) Densitometric analysis and statistical studies (means ± SEM) in Pkd1 RC/RC mice (n = 10, 5 animals per group and gender), *p < .01 versus CTR and LXV, # p < .01 versus LXV
