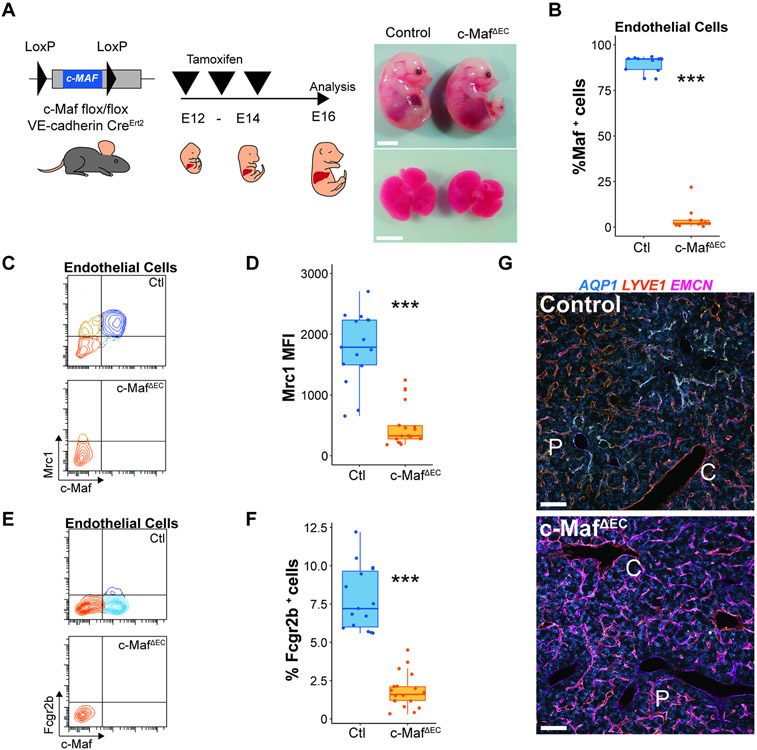
Figure 3. c-Maf choreographs the acquisition of sinusoidal attributes during maturation of immature liver capillaries.
(A) c-Mafflox/flox mice were crossed with VEcadherin(Cdh5)-CreErt2 mice, induced with tamoxifen from E12 to E14, to generate c-MafDEC mice and analyzed at the E16 developmental time point. Fetal embryos and livers from control and c-MafΔEC mice are shown. Scale bars 500 μm. (B) Flow cytometry analysis of the vasculature showing the deletion specificity of c-Maf within the ECs. Student’s t test analysis ***p < 0.001 (n = 12). (C) Flow cytometry analysis of the expression of c-Maf and Mrc1 at E16.5 in control and c-MafΔEC mice. (D) Analysis of the medium fluorescence intensity of Mrc1 expression in ECs in the control and c-MafΔEC mice. Student’s t test analysis ***p < 0.001 (n ≥ 15). (E) Flow cytometry analysis of the expression of c-Maf and Fcgr2b at E16.5 in control and c-MafΔEC mice. (F) Analysis of the percentage of ECs positive for Fcgr2b in the control and c-MafΔEC mice. 5Student’s t test analysis ***p < 0.001 (n ≥ 15). (G) Immunofluorescence analysis of the vascular markers Aqp1, Lyve1, and Emcn in control and c-MafΔEC mice at E16.5 of development, induced as shown in (A) from n = 5 mice. “C” represents central vein and “P” represents portal vein. Scale bars: 100 μm.

