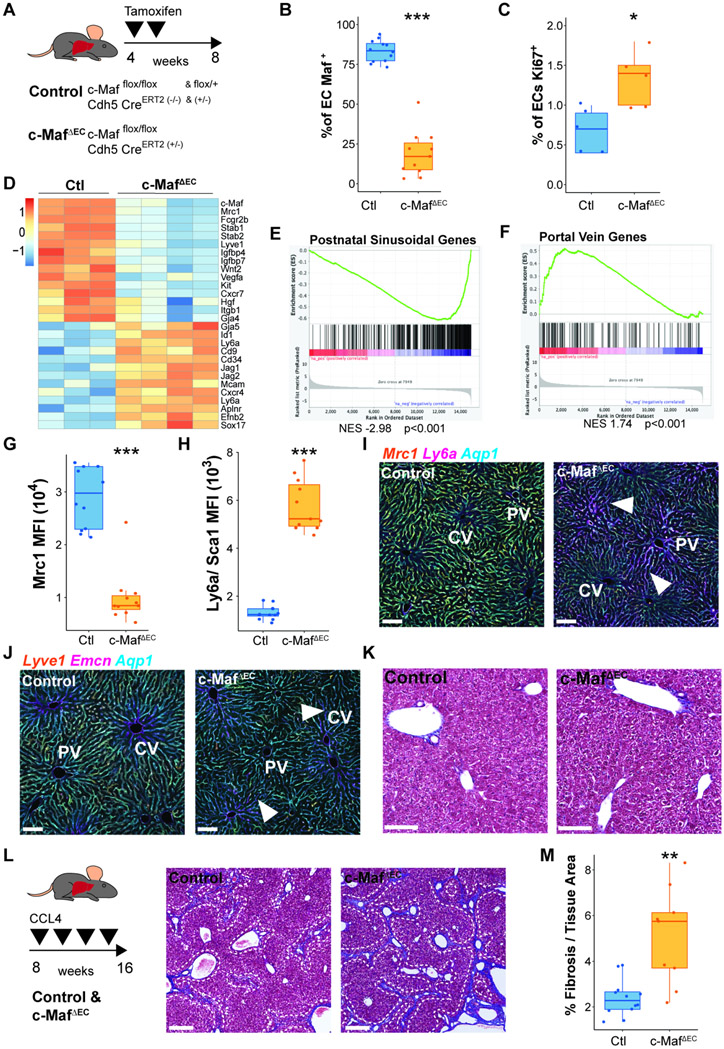
Figure 5. c-Maf adult vascular deficiency aberrantly induces a Portal Vein signature of the capillaries and facilitates stress-induced liver fibrosis.
(A) Induction of c-Maf deficiency in c-Mafflox/floxVEcadherin(Cdh5)-CreERT2 mice specifically in vascular endothelium was performed by tamoxifen administration after P30 using 3 days on, 3 days off, and 3 days on protocol, to generate c-MafΔEC mice. (B) Analysis of vascular ECs shows c-Maf deletion within the endothelium. Student’s t test analysis ***p < 0.001 (n ≥ 11). (C) Flow cytometry analysis of the percentage of Ki67 positive cells within the ECs. Student’s t test analysis *p < 0.05 (n = 5). (D) Bulk RNA-seq analysis of adult liver ECs isolated from control and c-MafΔEC mice, showing the differential expression signatures between them. (E) GSEA analysis of the postnatal sinusoidal gene list from population PS5 identified in Figure 1B. The analysis shows a decrease in the expression of sinusoidal genes associated within the c-MafΔEC mice. (F) GSEA analysis of the portal vein gene list from population PV identified in Figure 1B. The analysis shows an increase in the expression of these genes within the c-MafΔEC mice. (G and H) Flow cytometry quantification of the medium fluorescence intensity of sinusoidal marker Mrc1 (G) and Ly6a/Sca1 (H) expression in control and c-MafΔEC mice. Student’s t test analysis ***p < 0.001 (n ≥ 11). (I and J) Immunofluorescence analysis of the expression of liver vascular markers Mrc1, Ly6a/Sca1, Lyve1, Emcn, and Aqp1 in control and c-MafΔEC mice. Representative image from n = 5. Scale bars, 100 μm. “CV” represents central vein, “PV” represents portal vein. Arrows show expression of Ly6a and Emcn within the sinusoids in I and J, respectively. (K) Representative images of Masson’s trichrome from n = 3 of control and c-MafΔEC mice under basal conditions. A small fraction of fibrosis deposition could be observed surrounding the portal vein, both in the control and the c-MafΔEC mice. Scale bars: 100 μm. (L) Induction of fibrosis using CCl4 treatment in control and c-MafΔEC mice 1 month after deletion was induced. Representative images of Masson’s trichrome from n ≥ 9 of control and c-MafΔEC mice, showing the fibrotic deposition in blue. Image shows a zoom region from a tile scan of the whole liver. The white dashed line follows the fibrosis area. Scale bars 200 μm. (M) Quantification of the percentage of fibrosis over the total tissue area of control and c-MafΔEC mice. Student’s t test analysis **p < 0.01 (n ≥ 9).

