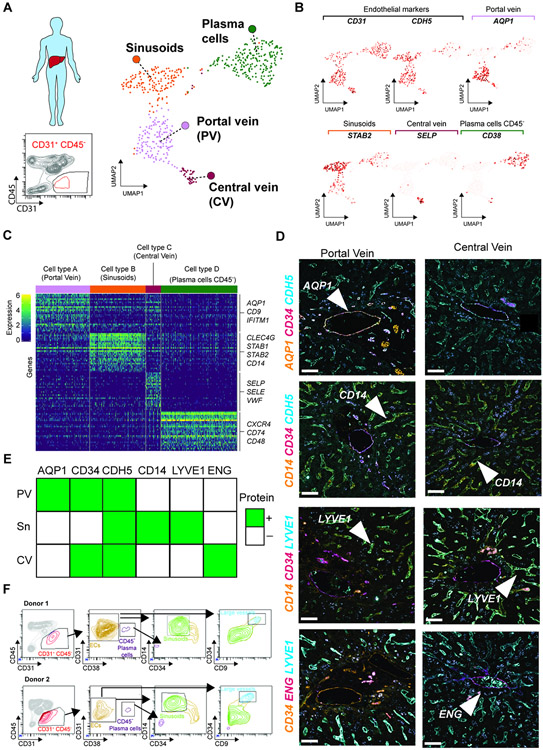
Figure 6. Human liver EC subpopulations can be identified by the expression of unique differential markers acquired by immunofluorescence and flow cytometry.
(A) Human liver CD45negCD31+ cells were sorted and analyzed by scRNA-seq analysis (n = 1). UMAP analysis of the EC compartment from the human liver sorted as CD45negCD31+ cells. Colors represent each population identified, based on their differentially expressed markers. (B) ScRNA-seq analysis of human liver CD45negCD31+ cells identified four clusters based on the expression of specific markers such as CD31, CDH5, AQP1, STAB2, SELP, or CD38. We used the co-expression of both CD31 and CDH5 to identify the ECs. These four clusters were associated with the portal vein, sinusoids, central vein, and putative hematopoietic plasma cells (CD45negCD38+). (C) Identification of the expression of cluster-associated specific markers between each subpopulation represented as a heatmap. Colors show the varying expression levels of each gene per cell. (D) Immunofluorescence validation of the vascular markers identified by single-cell RNA-seq analysis allows the identification of specific markers associated with the portal vein, sinusoids, or central vein based on the expression of Aqp1, Cd34, Cdh5, Cd14, Lyve1, and Eng. Arrows represent the labeling of the gene in a particular population. Representative images from 3 patients. Scale bars, 100 μm. (E) Table representing the identification of protein expression by immunofluorescence on the portal vein (PV), sinusoids (S), or central vein (CV) in the human liver. Green color indicates positive identification of expression in (D). (F) Identification by flow cytometry of the different vascular subpopulations found in the scRNA-seq, based on the expression of the surface markers CD45, CD31,CD38, CD14, CD34, and CD9, performed in two different human liver samples.

