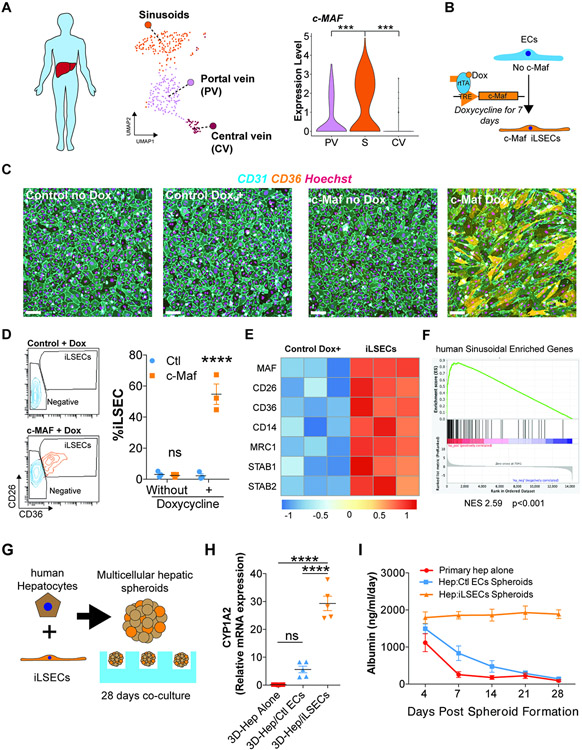
Figure 7. c-Maf induces a pro-regenerative liver signature in vascular ECs, enabling long-term sustenance of co-cultured hepatocytes.
(A) Expression of c-Maf in the EC subpopulations from the human single-cell analysis. UMAP represents the different EC populations identified. The results show an enrichment in the sinusoidal population (S) compared with the portal vein (PV) and central vein (CV). Student’s t test comparison between total cells per cluster from n = 1 sample, ***p < 0.001. (B) Diagram representing the induction of c-Maf overexpression in human ECs in vitro using an inducible doxycycline system for 7 days. (C) Immunofluorescence analysis of the expression of CD31 and CD36 in ECs transduced with a lentivirus control or lentivirus overexpressing c-Maf under the control of doxycycline. Nuclei are stained with Hoechst. Analysis of cell cultures of control and c-Maf cells, with or without doxycycline, for 7 days. Representative image of n = 3. Scale bars, 100 μm. (D) Flow cytometry identification and quantification of induced LSECs (iLSECs) after the administration of doxycycline. Cells overexpressing c-Maf acquire elevated expression of CD26 and CD36. Representative flow of n = 3 (different donors). Data are presented as mean ± SEM. Two-way ANOVA ****p < 0.0001 (n = 3). (E) Bulk RNA-seq analysis of control and iLSECs treated for 7 days with doxycycline. Heatmap shows differential expression analysis between the iLSEC sorted population overexpressing c-Maf and control cells from n = 3 donor cells. (F) GSEA analysis of the expression values of the human sinusoidal enriched genes from Figure 6A identified an upregulation of the sinusoidal signature in the iLSECs. (G) Representation of the co-culture of human hepatocytes and iLSECs to generate spheroids. (H) qRT-PCR results indicating relative CYP1A2 expression at day 28 of the co-culture of human hepatocytes (Hep) with ECs (control or iLSECs) or hepatocytes alone. Data are presented as mean ± SEM. One-way ANOVA, ****p < 0.0001 (n = 5). (I) ELISA quantification of the expression of albumin over the 28-day co-culture of hepatocytes (Hep) with ECs (control or iLSECs). Data are presented as mean ± SEM (n = 5).

