FIGURE 3.

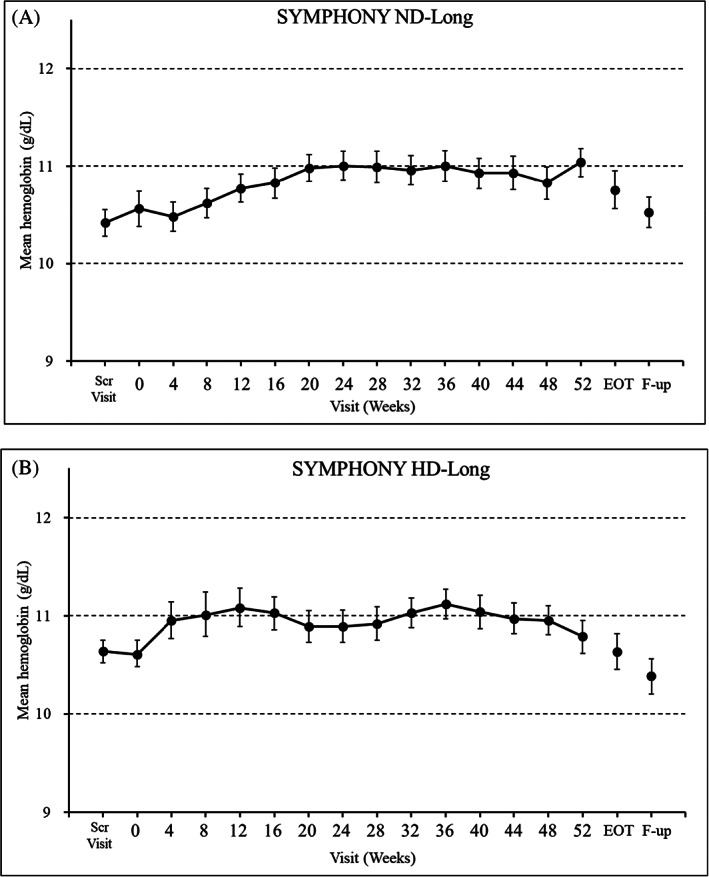
The mean (95% confidence interval) hemoglobin levels in the (A) SYMPHONY ND‐Long and (B) SYMPHONY HD‐Long studies (full analysis set). EOT, end of treatment; F‐up, Follow‐up Visit; Scr Visit, Screening Visit

The mean (95% confidence interval) hemoglobin levels in the (A) SYMPHONY ND‐Long and (B) SYMPHONY HD‐Long studies (full analysis set). EOT, end of treatment; F‐up, Follow‐up Visit; Scr Visit, Screening Visit