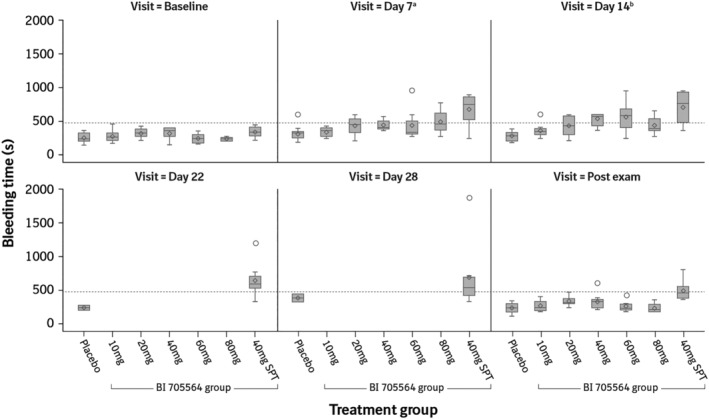
FIGURE 1.

Bleeding time at different timepoints in the multiple‐rising dose study by treatment group and visit. Data are presented as median (horizontal line), interquartile range (boxes), and minimum and maximum (vertical lines). The open circles represent outliers (values less than the 25% quartile or greater than the 75% quartile by >1.5× the interquartile range). The dashed line represents the upper limit of normal (480 s). Maximum bleeding time was truncated at 600 s for the BI 705564 10, 20 and 40 mg dose groups, thus the values represented in the figure could be underestimated for these groups. aDay 8 for the SPT group; bDay 15 for the SPT group. SPT, skin prick test
